Active binning
getbw.RdComputes binwidth and breakpoints for a numeric or integer variable. The binwidth is a multiple of the minimal non-zero distance between two neighboring observations. The binwidth is chosen such that the number of active bins is as close as possible to a desired number k.
An active bin is a bin which contains at least min_n observations.
getbw(x, k = NULL, min_n = NULL, warn = FALSE)
Arguments
| x | A numeric variable. |
|---|---|
| k | The desired number of active bins. A bin is active if it contains at least |
| min_n | The minimum number of observations necessary for a bin to count as an active bin. Defaults to
|
| warn | I don't want to know about problems. |
Value
A vector of breakpoints with attributes "bw", "k" and "outlier". The first one is the binwidth, the second one is the number of active bins which is as close as possible to the specified parameter k. "outlier" is a logical vector indicating which bins are not active.
Note
Experimental.
See also
Examples
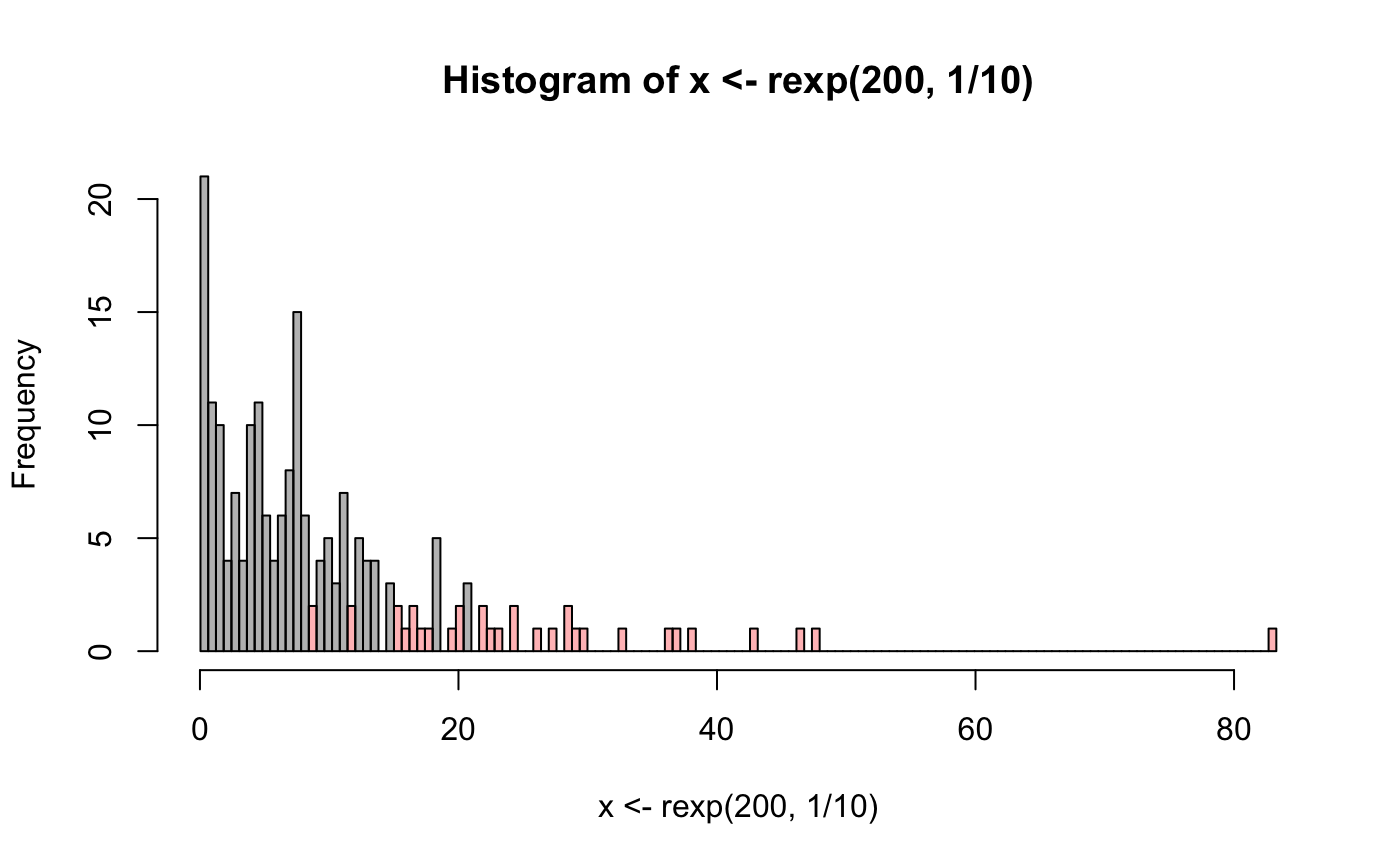
require(scales) hist(x <- rexp(200,1/10),breaks=gb<-getbw(x,24,min_n = 5, warn=TRUE), col = alpha(attr(gb,"outlier")+1,0.3))#> [1] 0.6 #> The number of observations is smaller than k*min_n. Reducing min_n to 3hist(x <- rexp(2000,1/10),breaks=gb<-getbw(x,24,min_n = 5,warn=TRUE), col = alpha(attr(gb,"outlier")+1,0.3))x <- rlnorm(1000,log(10),log(4)) x <- c(x, rnorm(500,400,30)) hist(x ,breaks=gb<-getbw(x,24,min_n = 5,warn=TRUE), col = alpha(attr(gb,"outlier")+1,0.3))x <- rlnorm(1000,log(10),log(4)) x <- c(x, rnorm(500,800,30)) hist(x ,breaks=gb<-getbw(x,24,min_n = 5,warn=TRUE), col = alpha(attr(gb,"outlier")+1,0.3))# NOT RUN { bws1 <-replicate(1000,{ x <- rexp(200,1/10) gb <- getbw(x,20) attr(gb,"bw") }) hist(bws1,breaks=getbw(bws1,30)) bws2 <-replicate(1000,{ x <- rnorm(200) x <- x/rnorm(200) gb <- getbw(x,20) attr(gb,"bw") }) hist(bws2,breaks=getbw(bws2,30)) mov <- read.table("http://www.rosuda.org/lehre/WS1213-f/MovieLens.txt", header=T, sep="\t") require(extracat) with(mov,plot(MovieVotes,meanMovieRat, pch=19,col=alpha("black",0.2))) with(mov, fluctile(table(cutbw(MovieVotes,30), cutbw(meanMovieRat,30)))) with(USR, fluctile(table(occupation,cutbw(meanUserRat,30)), dir="h",just="b")) with(USR, fluctile(log(1+table(cutbw(Pct.Animation,50), cutbw(Pct.Children.s,50))))) with(USR, barplot(table(cutbw(Pct.Animation,50,min_n=5)))) # }