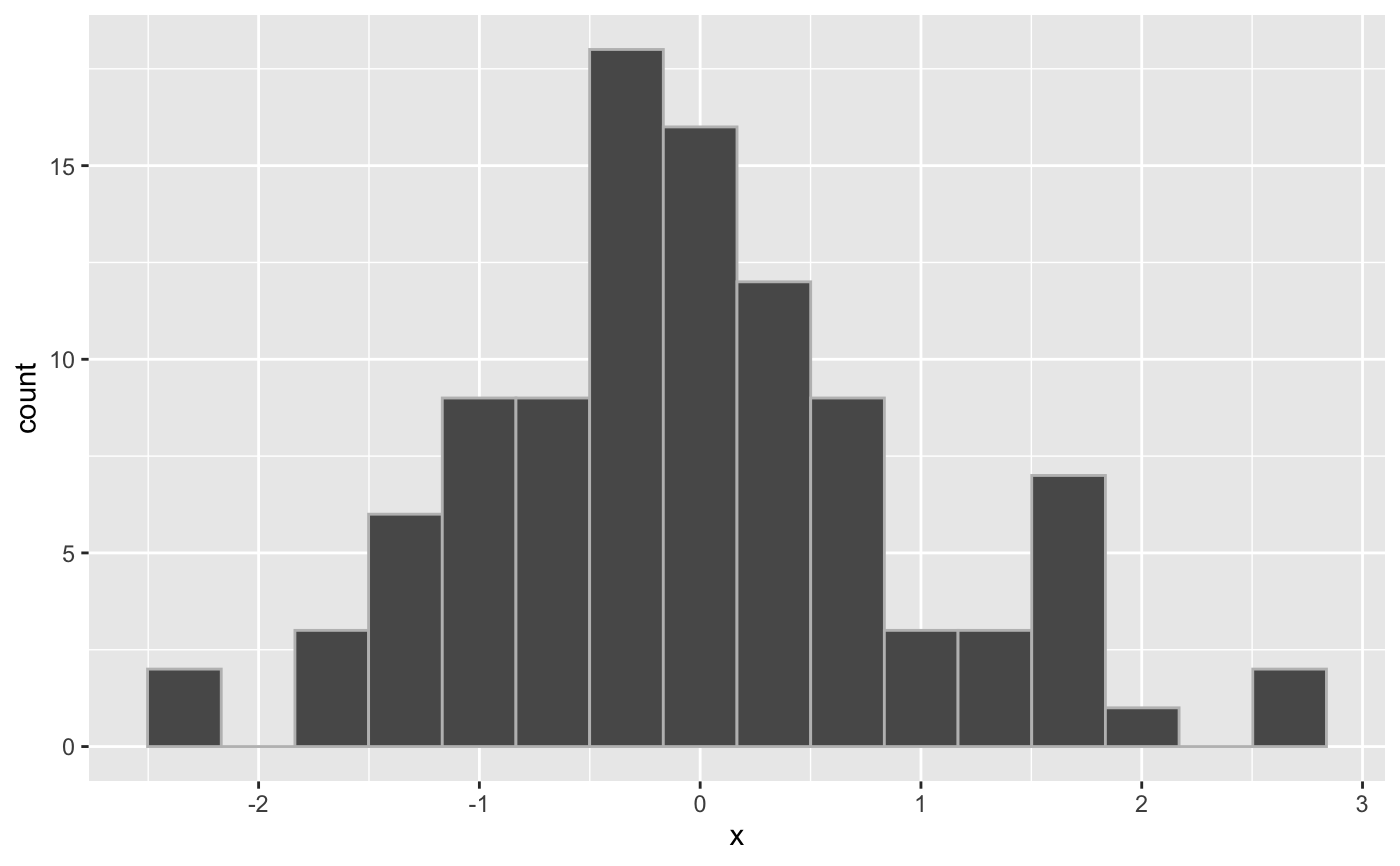
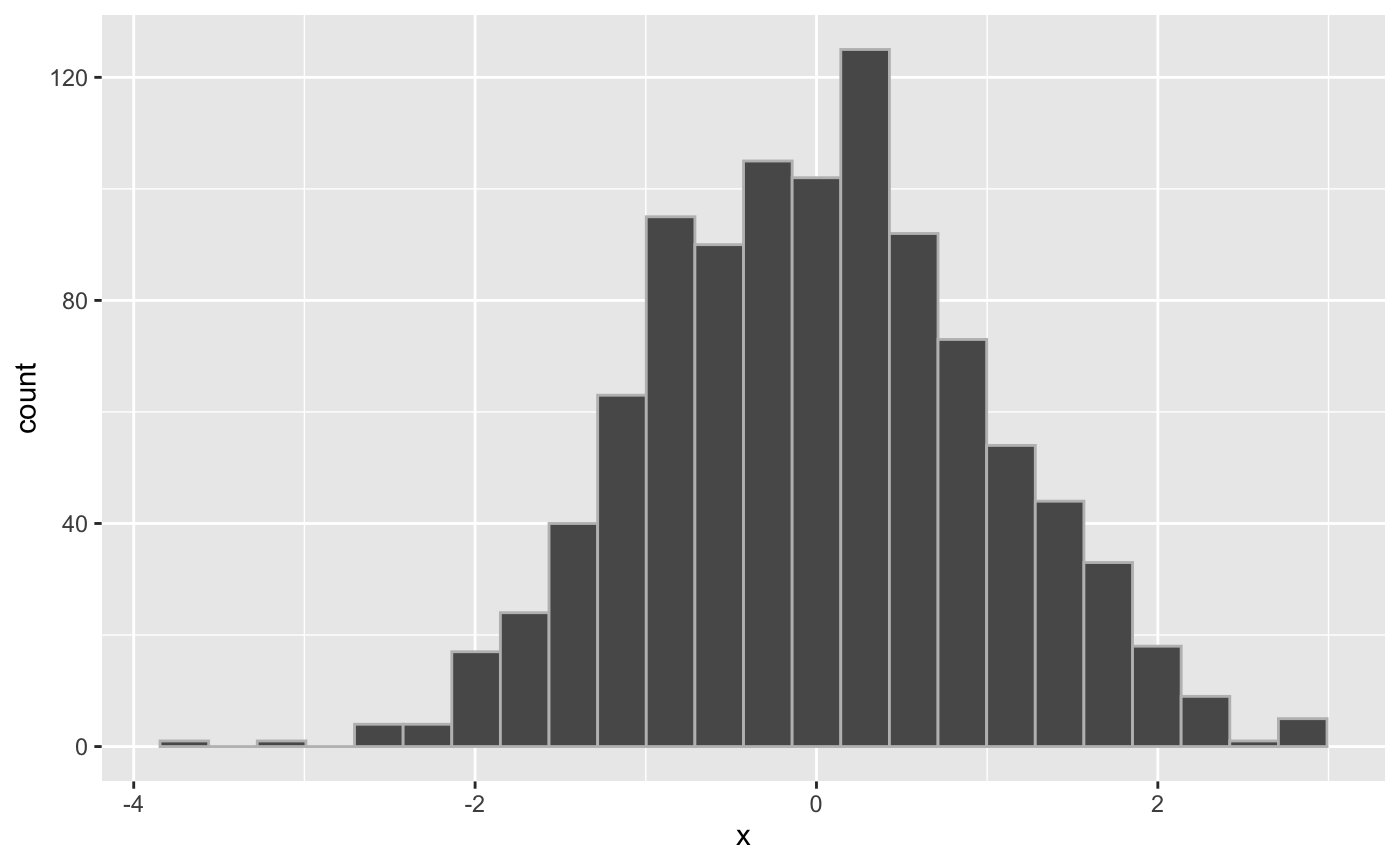
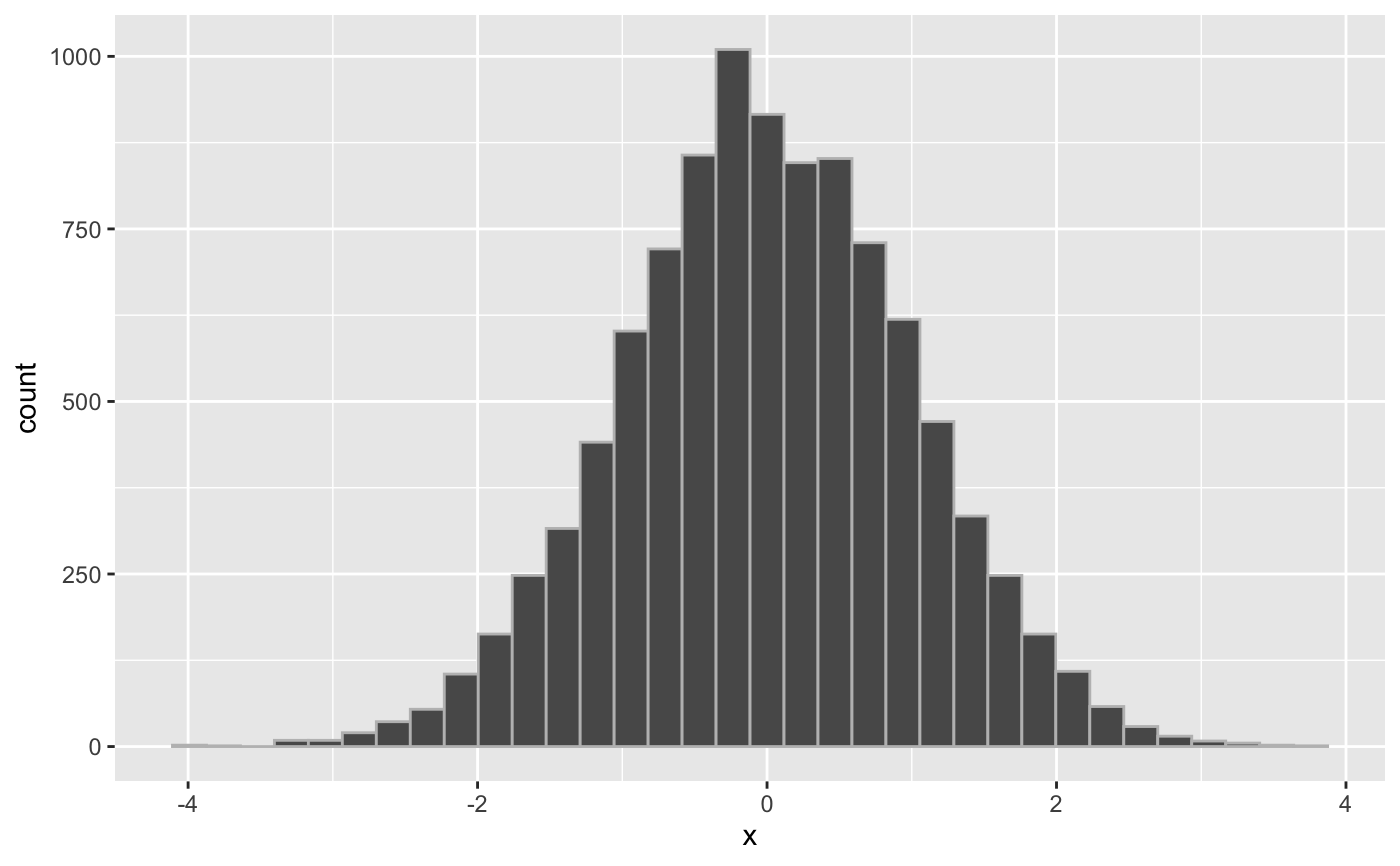
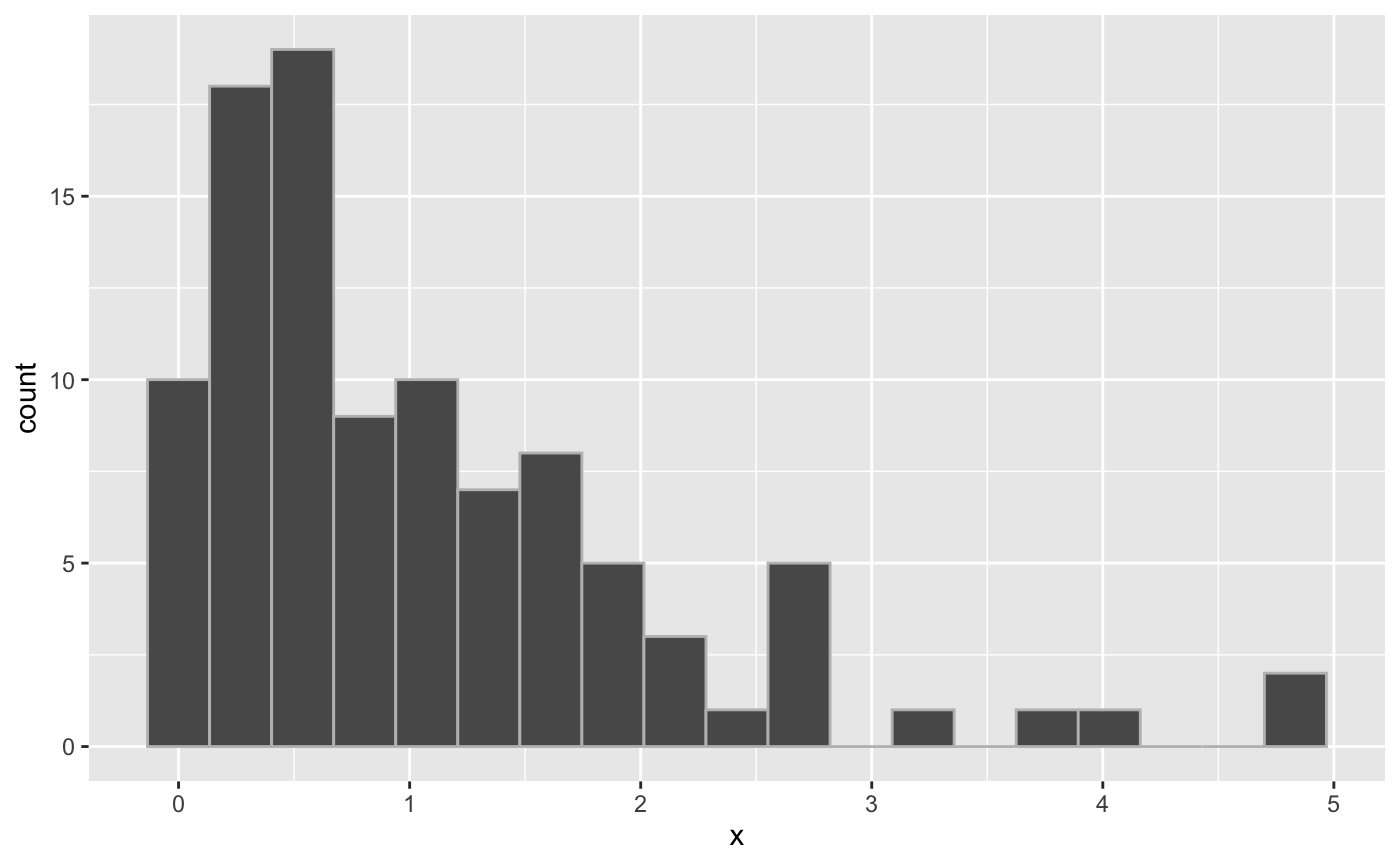
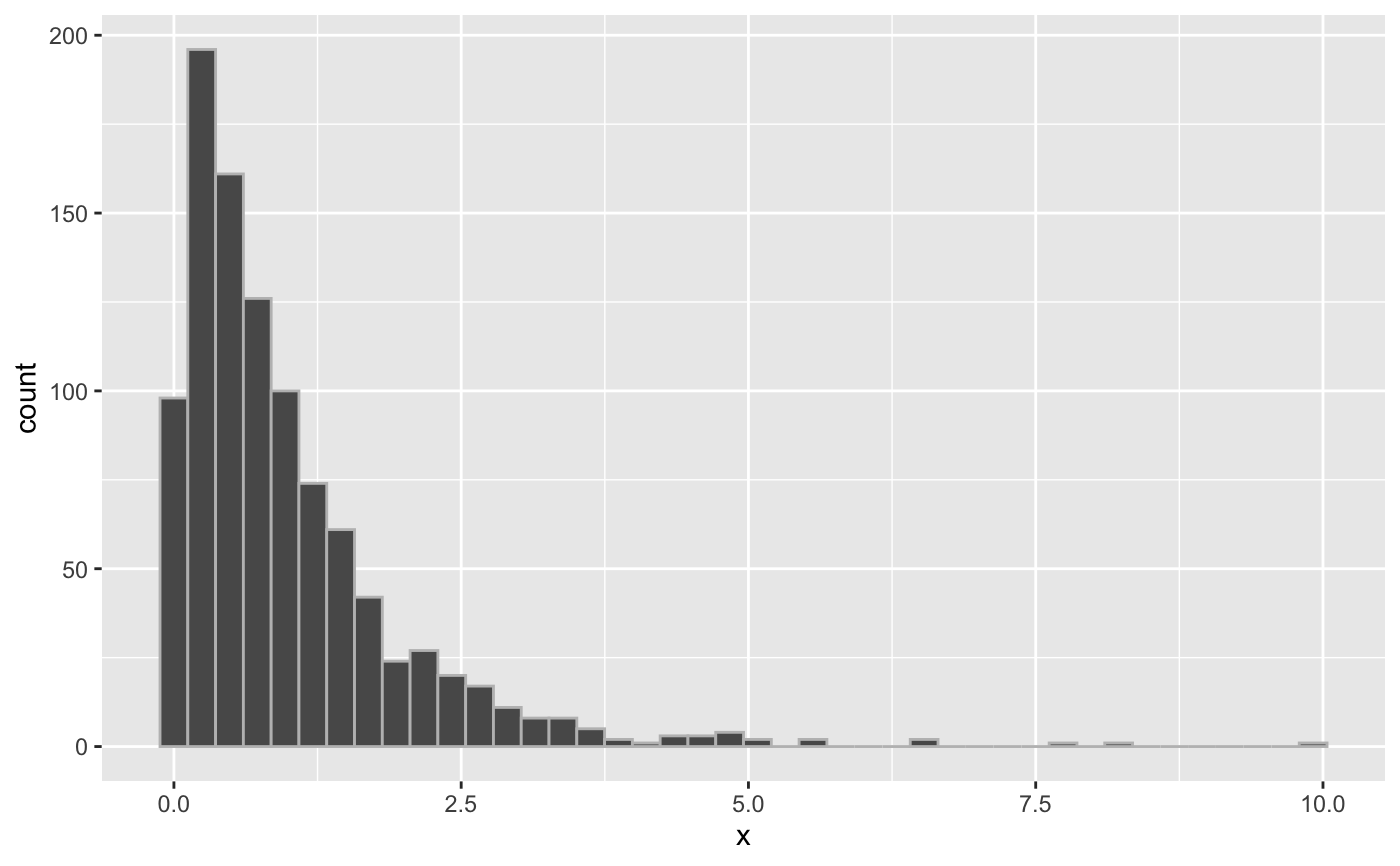
Histogram using active bins
ahist.RdA standard histogram using getbw to compute the binwidth and breakpoints.
ahist(x, k = NULL, m = NULL, fun = "qplot", col = "grey", ival = NULL)
Arguments
| x | A numeric vector. |
|---|---|
| k | The desired number of active bins. A bin is active if it contains at least |
| m | The minimum number of observations necessary for a bin to count as an active bin. Defaults to
|
| fun | Either |
| col | The color for the bars. |
| ival | If this is set to a numeric value in |
Value
The ggplot object.
Note
This is purely experimental at this time.
See also
Examples
#> Warning: `geom_bar()` no longer has a `binwidth` parameter. Please use `geom_histogram()` instead.#> Warning: `geom_bar()` no longer has a `binwidth` parameter. Please use `geom_histogram()` instead.#> Warning: `geom_bar()` no longer has a `binwidth` parameter. Please use `geom_histogram()` instead.#> Warning: `geom_bar()` no longer has a `binwidth` parameter. Please use `geom_histogram()` instead.#> Warning: `geom_bar()` no longer has a `binwidth` parameter. Please use `geom_histogram()` instead.#> Warning: `geom_bar()` no longer has a `binwidth` parameter. Please use `geom_histogram()` instead.# NOT RUN { ahist(rcauchy(1000)) ahist(rcauchy(1000), ival = 0.95) x <- c(rnorm(400),rnorm(200, mean=6)) ahist(x) x <- c(rnorm(400),rnorm(200, mean=16)) ahist(x) x <- c(rnorm(400),rnorm(200, mean=32)) ahist(x) # }