productplots
2k downloads last month, 341k total downloads
CRAN release
Graphics

Monthly  Total
Total 
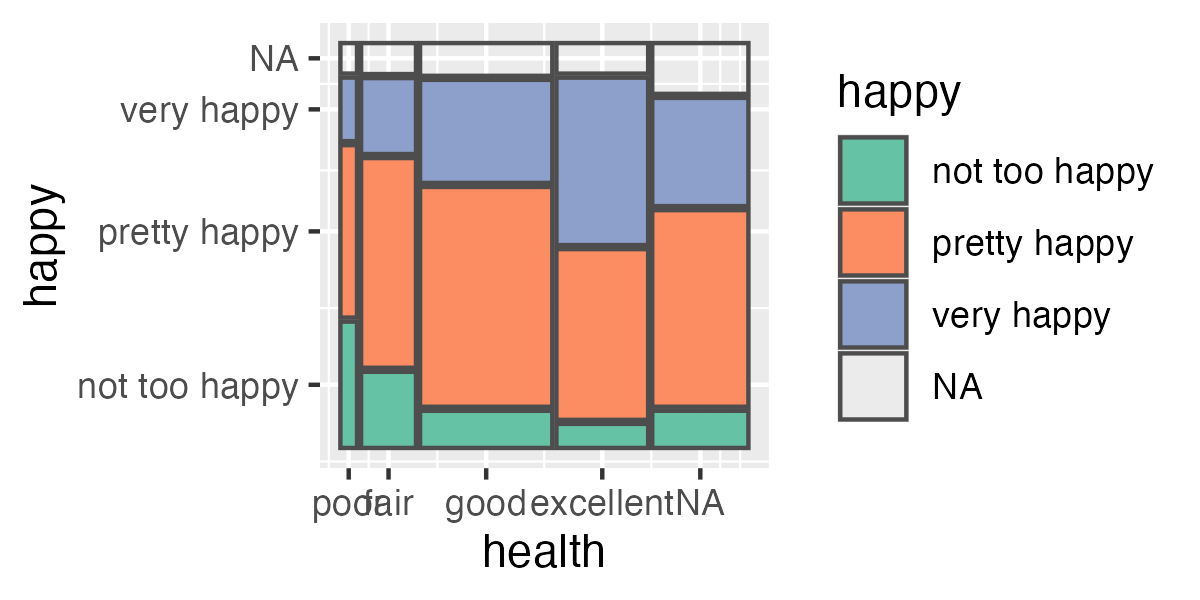
Framework for visualising tables of counts, proportions and probabilities. The framework is called product plots, alluding to the computation of area as a product of height and width, and the statistical concept of generating a joint distribution from the product of conditional and marginal distributions. The framework, with extensions, is sufficient to encompass over 20 visualisations previously described in fields of statistical graphics and ‘infovis’, including bar charts, mosaic plots, ‘treemaps’, equal area plots and fluctuation diagrams.