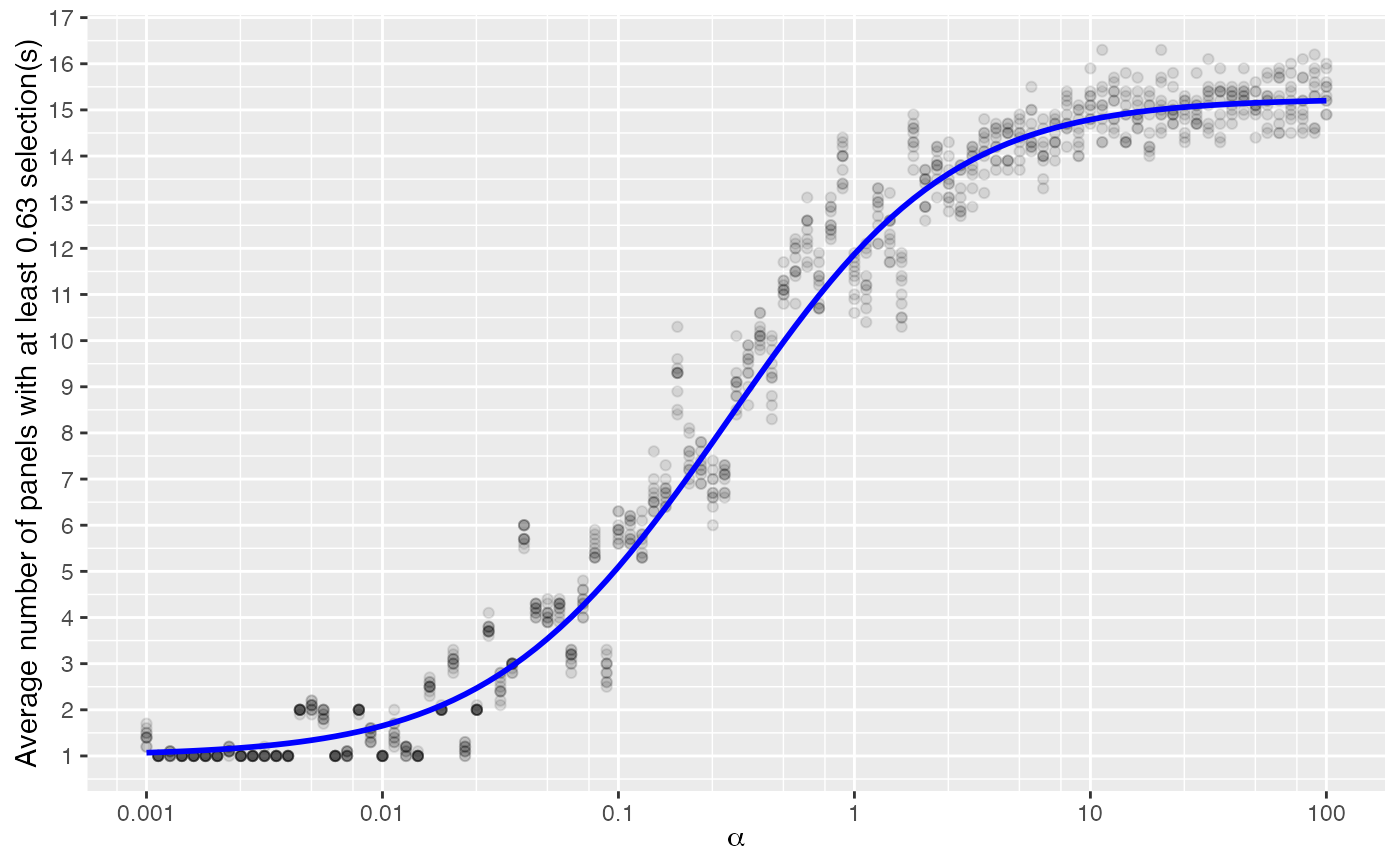
The visual estimation plot contains the expected number of interesting panels for each alpha value under the specified experimental conditions and simulated lineup experiments under each scenario which provide some information about the expected variability.
estimate_alpha_visual(
  c = m0/K,
  m0 = 19,
  K = 30,
  alphas = 10^seq(-3, 2, 0.05),
  ...
)
Arguments
- c
The number of selections a panel must have to be interesting (can be non-integer)
- m0
The number of null panels in the lineup
- K
The total number of null panel selections (or, in a Rorschach lineup, the total number of evaluations)
- alphas
Numeric vector of alpha values to conduct simulations for
- ...
additional arguments to sim_interesting_panels
Examples
estimate_alpha_visual()
#> Warning: Using `size` aesthetic for lines was deprecated in ggplot2 3.4.0.
#> ℹ Please use `linewidth` instead.
#> ℹ The deprecated feature was likely used in the vinference package.
#>   Please report the issue to the authors.