The Blue Alliance API v3 is specified at https://www.thebluealliance.com/apidocs/v3.
The function get_records takes a call to any of the TBA lists under list and returns, if possible, all records in a data frame.
In case the results can not be converted to a data frame, they are returned as list.
Examples
events <- get_records("events/2024")
events[grep("Corn", events$name),] # yep, there is an event with 'Corn' in it
#> # A tibble: 1 × 30
#>   address  city  country district$abbreviation division_keys end_date event_code
#>   <chr>    <chr> <chr>   <chr>                 <list>        <chr>    <chr>
#> 1 3650 Wo… West… USA     NA                    <chr [0]>     2024-09… iawes
#> # ℹ 26 more variables: district$display_name <chr>, $key <chr>, $year <int>,
#> #   event_type <int>, event_type_string <chr>, first_event_code <chr>,
#> #   first_event_id <chr>, gmaps_place_id <chr>, gmaps_url <chr>, key <chr>,
#> #   lat <dbl>, lng <dbl>, location_name <chr>, name <chr>,
#> #   parent_event_key <chr>, playoff_type <int>, playoff_type_string <chr>,
#> #   postal_code <chr>, short_name <chr>, start_date <chr>, state_prov <chr>,
#> #   timezone <chr>, webcasts <list>, website <chr>, week <int>, year <int>

table(events$state_prov)
#>
#>                 AL                 AR                 AZ                 BC
#>                  1                  2                 10                  1
#>            Beijing                 CA                 CO                 CT
#>                  1                 20                  3                  4
#>              Coah.                 DF                 FL                 GA
#>                  1                  1                  3                  6
#>               Gto.                 HI     Haifa District                 IA
#>                  1                  1                  6                  2
#>                 ID                 IL                 IN Jerusalem District
#>                  2                  4                  7                  1
#>                 KS                 KY                 LA                 MA
#>                  1                  1                  3                 11
#>                 MD                 ME                 MI                 MN
#>                  3                  3                 47                 13
#>                 MO                 MS                 MT               N.L.
#>                  6                  1                  1                  1
#>                 NC                 ND                 NH                 NJ
#>                 10                  3                  8                  8
#>                NSW                 NV                 NY                 OH
#>                  2                  1                 11                  5
#>                 OK                 ON                 OR                 PA
#>                  2                 16                  7                  7
#>                 QC                 RI                 SC                SON
#>                  1                  1                  4                  1
#>                 TN                 TX        Taipei City                 UT
#>                  2                 27                  1                  1
#>                 VA                VIC                 WA                 WI
#>                  9                  1                 10                  8
#>                 WV           İstanbul
#>                  1                  7

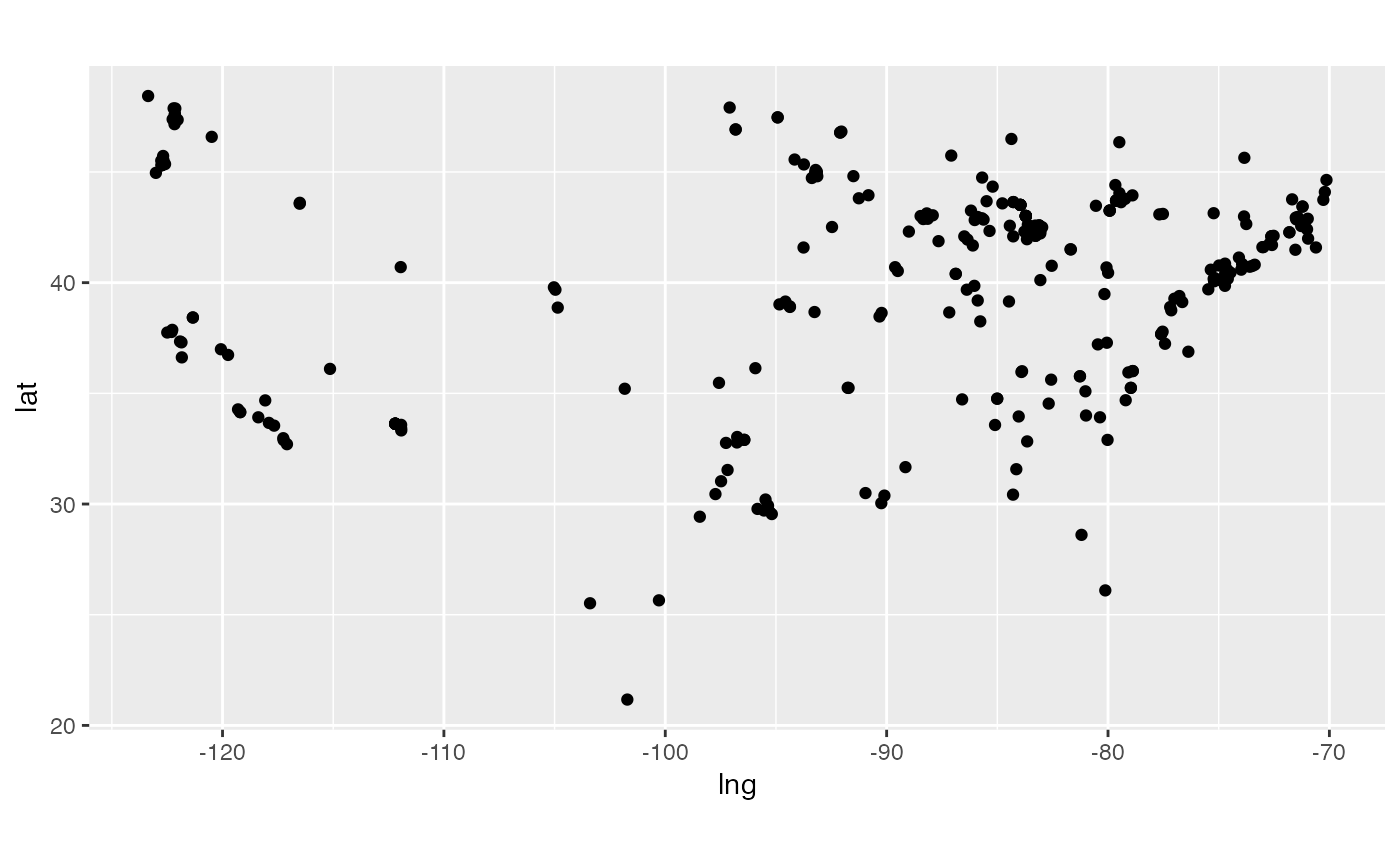
# now draw a map of all events in North America
require(ggplot2)
#> Loading required package: ggplot2
require(dplyr)
events %>% slice(grep("America", timezone)) %>%
  filter(lat > 20) %>% # sorry, South America
  ggplot(aes(x = lng, y = lat)) + geom_point() +
  coord_equal()