Outline of US states and equivalents
states.RdData from shapefiles provided by the Census Bureau’s MAF/TIGER geographic database at https://www.census.gov/geo/maps-data/data/cbf/cbf_state.html. State outlines are based on the 1:20m resolution level. Internal points, divisions and regions are based on TIGER/Line Shapefiles for states and equivalents in the 2016 release.
states

inset

division
Format
both objects are data frames consisting of variables of length ~13k:
long: geographic longitude
lat: geographic latitude
order: order of locations
piece: positive integer value, one for each separate area/island of a state
id: integer value uniquely identifying each state
group: character value - composite of id and piece, uniquely identifying each part of each state
STATEFP: FIPS state code
STATENS: GNIS state code
AFFGEOID: American FactFinder state code
GEOID: GEOID state code
STUSPS: US state code
NAME: name of state or state equivalent
ALAND: land area of the state/state equivalent in square meters
AWATER: water area of the state/state equivalent in square meters
REGION: integer of US region
REGION.NAME: name of US region
DIVISION: integer of US division
DIVISION.NAME: name of US division
INTPTLAT: latitude of interior point
INTPTLON: longitude of interior point
Examples
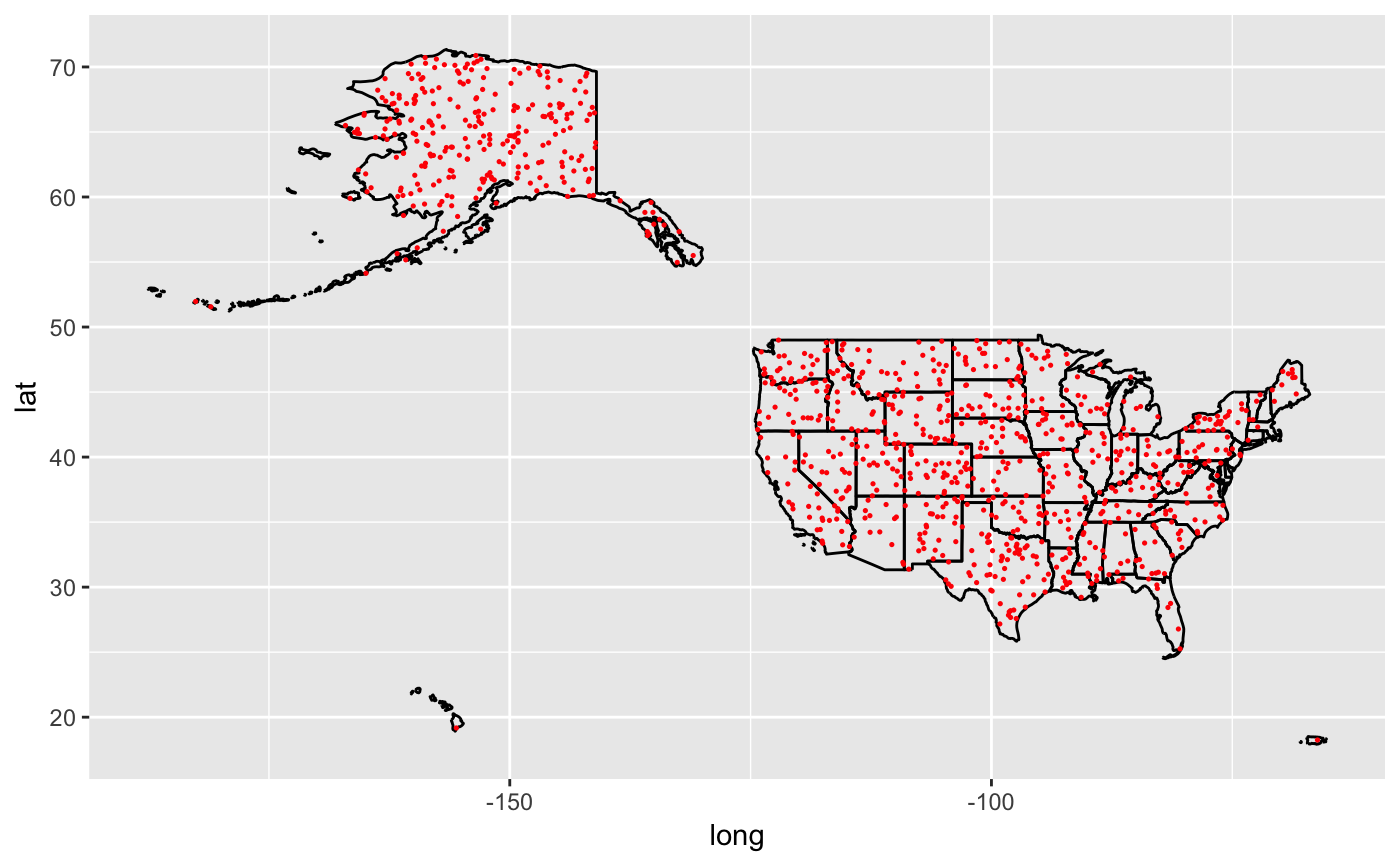
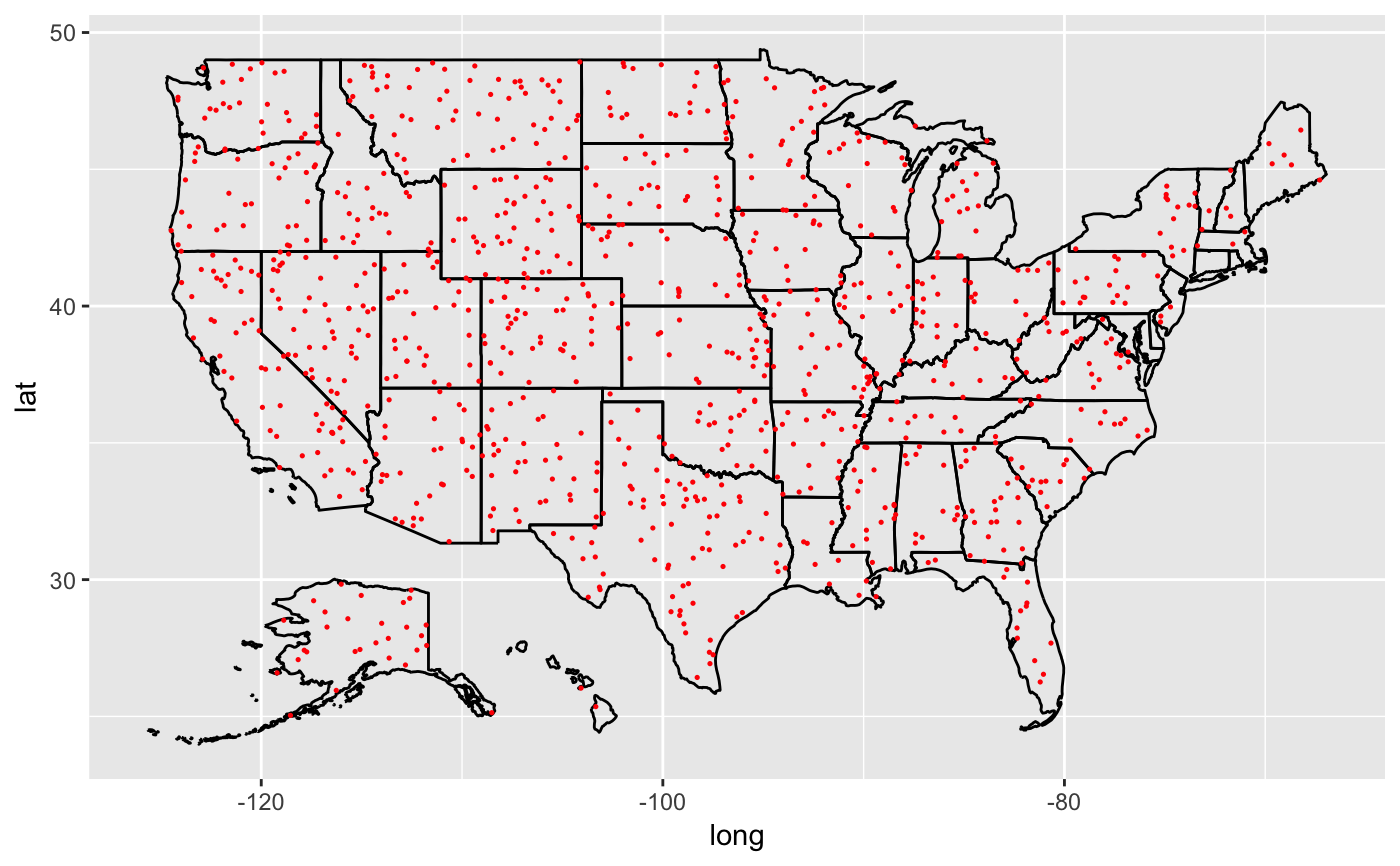
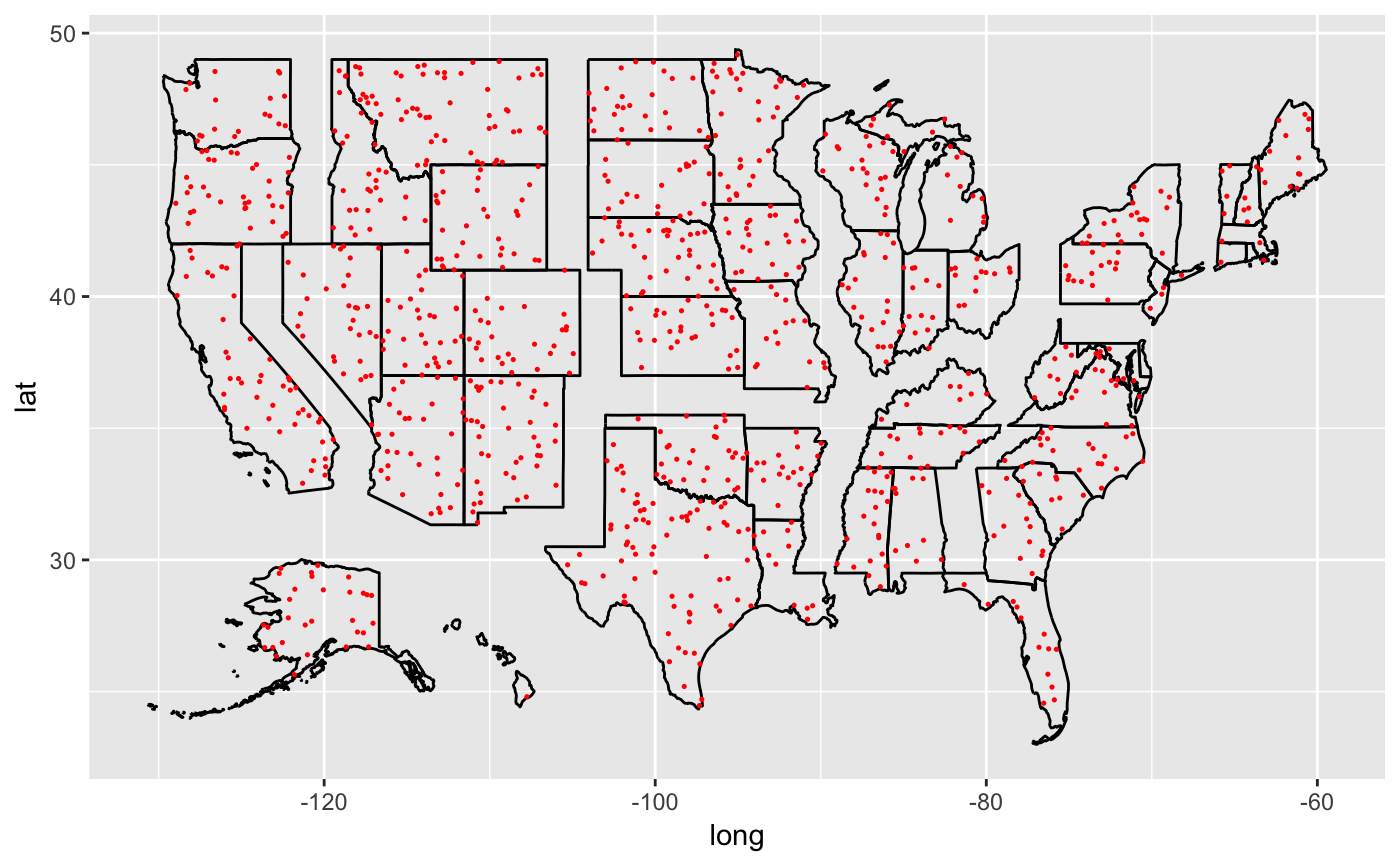
states %>% ggplot(aes(x = long, y = lat)) + geom_path(aes(group = group)) + geom_point(data = states %>% map_unif(n = 1000), colour = "red", size = 0.25)inset %>% ggplot(aes(x = long, y = lat)) + geom_path(aes(group = group)) + geom_point(data = inset %>% map_unif(n = 1000), colour = "red", size = 0.25)division %>% ggplot(aes(x = long, y = lat)) + geom_path(aes(group = group)) + geom_point(data = division %>% map_unif(n = 1000), colour = "red", size = 0.25)