Polls for the presidential general election
presidential_polls.RdScraped from FiveThirtyEight's website of most recent polls on July 28 2020.
presidential_polls
Format
A tibble with 5312 rows and 37 columns
- question_id
numeric
- poll_id
numeric
- cycle
numeric
- state
character
- pollster_id
numeric
- pollster
character
- sponsor_ids
numeric
- sponsors
character
- display_name
character
- pollster_rating_id
numeric
- pollster_rating_name
character
- fte_grade
character
- sample_size
numeric
- population
character
- population_full
character
- methodology
character
- office_type
character
- seat_number
numeric
- seat_name
logical
- start_date
Date
- end_date
Date
- election_date
Date
- sponsor_candidate
character
- internal
logical
- partisan
character
- tracking
logical
- nationwide_batch
logical
- ranked_choice_reallocated
logical
- created_at
character
- notes
character
- url
character
- stage
character
- race_id
numeric
- answer
character
- candidate_name
character
- candidate_party
character
- pct
numeric
Source
https://projects.fivethirtyeight.com/polls-page/president_polls.csv
Examples
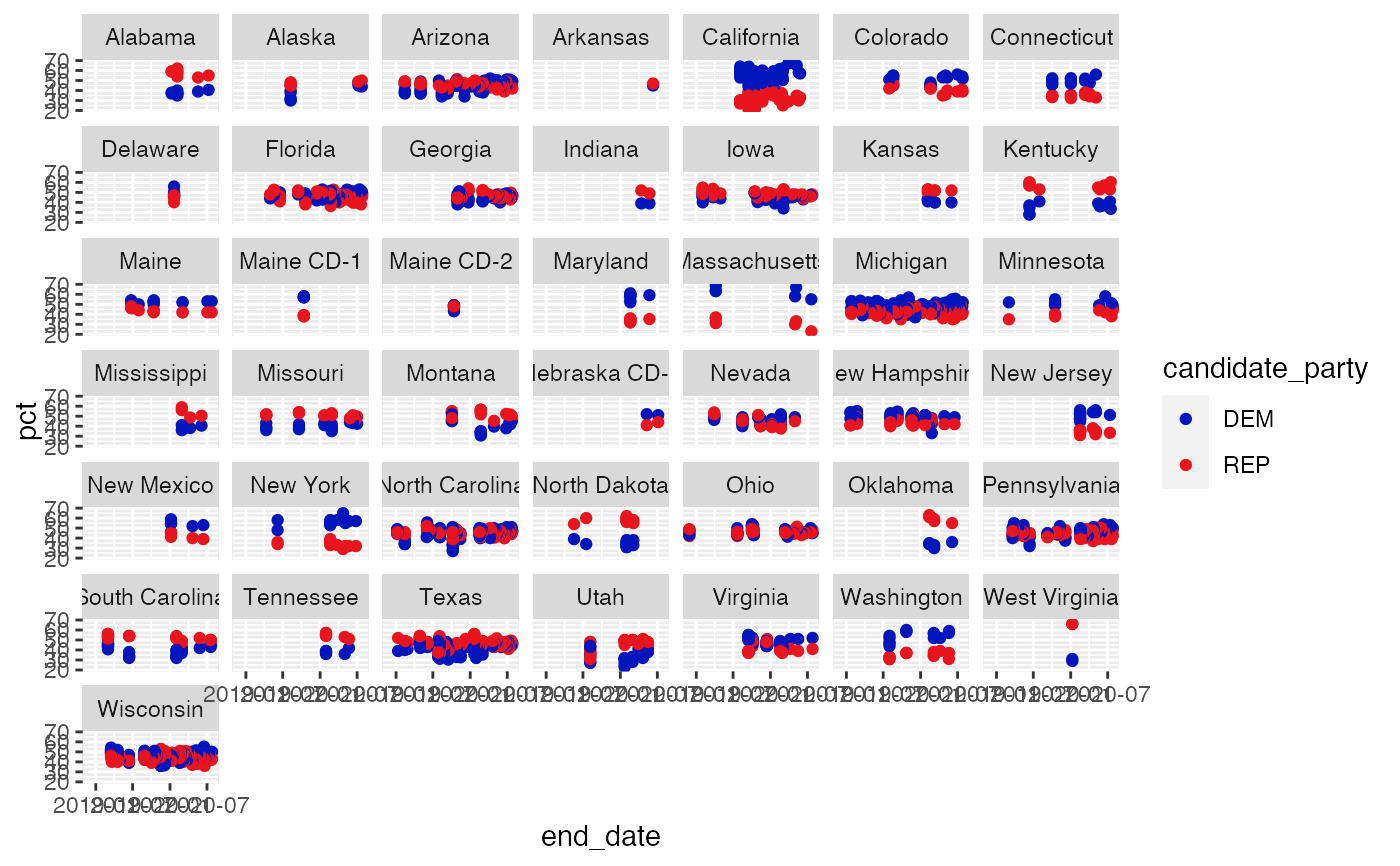
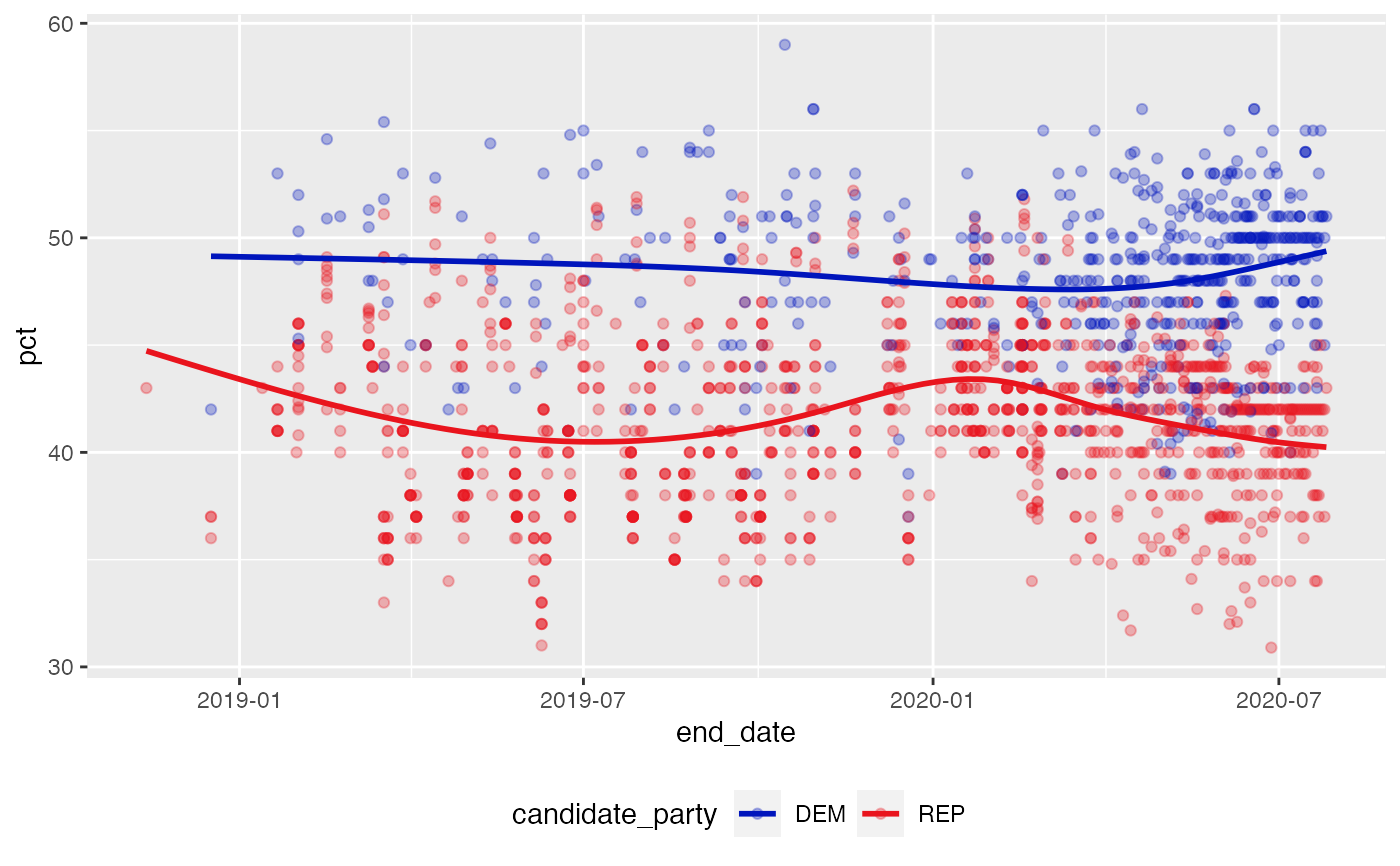
library(ggplot2) library(dplyr) data(presidential_polls) presidential_polls %>% filter(candidate_party %in% c("DEM", "REP")) %>% filter(!is.na(state)) %>% ggplot(aes(x = end_date, y = pct)) + geom_point(aes(colour = candidate_party)) + facet_wrap(~state) + scale_colour_party()# national polls presidential_polls %>% filter(candidate_party %in% c("DEM", "REP")) %>% filter(answer %in% c("Biden", "Trump")) %>% filter(is.na(state)) %>% ggplot(aes(x = end_date, y = pct, colour = candidate_party)) + geom_point(alpha = 0.3) + geom_smooth(se = FALSE, method="gam") + scale_colour_party() + theme(legend.position="bottom")#>

