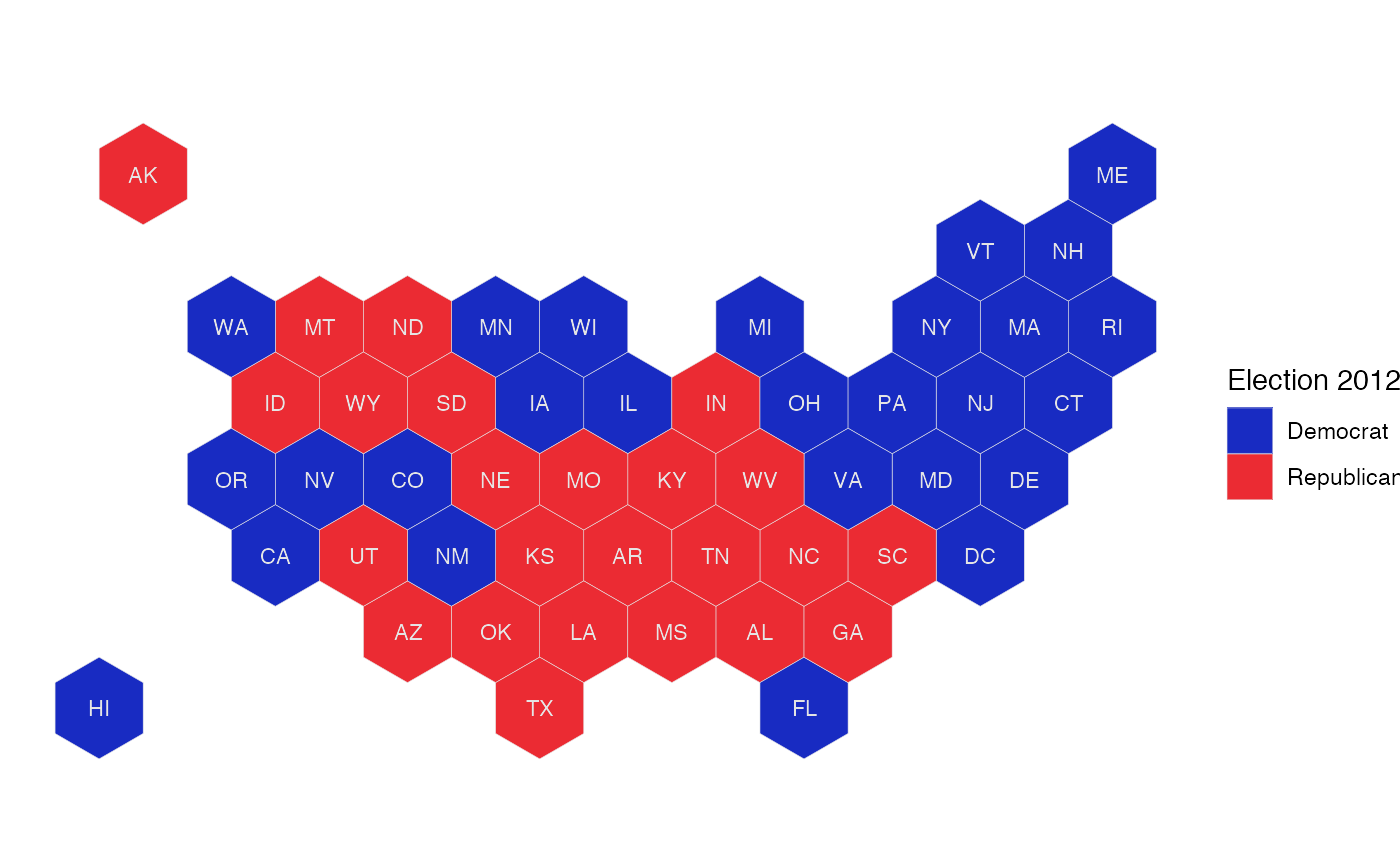
Hexagonal cartogram of the US by state
hexplot.RdAdd fill colour to a hexgonal cartogram of the US
hexplot(states, fill, label = TRUE, labelcolor = "grey90")
Arguments
| states | vector of state names |
|---|---|
| fill | vector mapping to fill color, same order as states |
| label | logical. Should labels be shown? |
| labelcolor | colour in which labels are shown. Ignored if `label=FALSE`. |
Value
ggplot2 object
Examples
data(elections)
el12 <- elections %>% dplyr::filter(year == 2012)
hexplot(el12$state, el12$perc_rep > el12$perc_dem) +
  scale_fill_party("Election 2012", labels=c("Democrat", "Republican"))