Create an Electoral Snake Plot
ggsnake.RdCreate an Electoral Snake Plot
ggsnake(data, order, label, fill, color, size)
Arguments
| data | data frame |
|---|---|
| order | variable to use to order the snake segments |
| label | variable to use to label the segments (also used as a grouping variable) |
| fill | variable to use to fill the segments in |
| color | variable to use to outline the segments |
| size | variable to use to determine how many segments are allocated to a group |
Examples
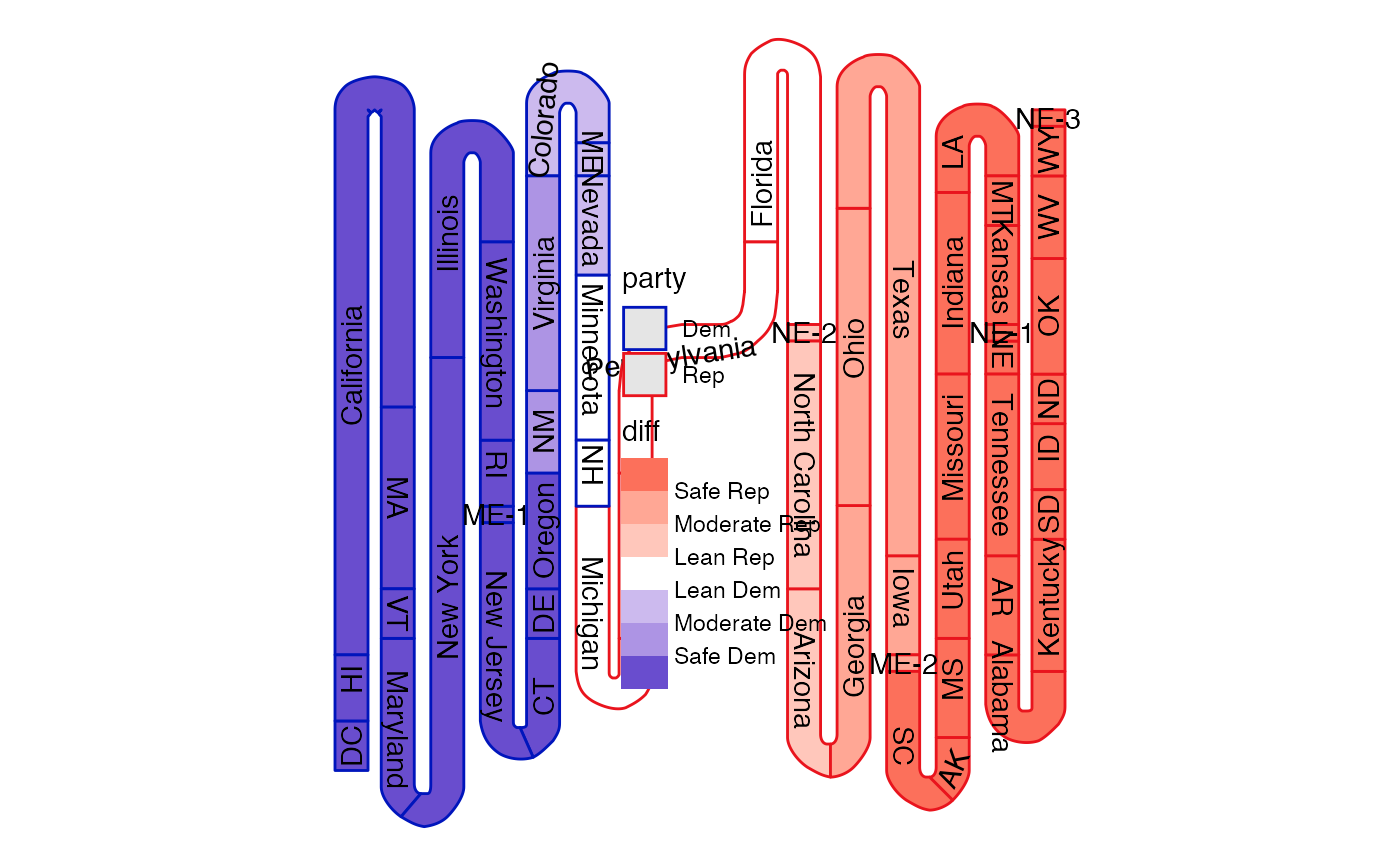
#> #>#> #> #>#> #> #>electoral_votes_2016 %>% mutate(diff = perc_rep - perc_dem, party = ifelse(perc_dem > perc_rep, "Dem", "Rep"), label = clean_districts(state_district, electoral_votes)) %>% ggsnake(order = diff, fill = diff, label = label, color = party, size = electoral_votes) + scale_fill_party_binned() + scale_color_party()#>
