Numbers of crimes by state and source
fbi.v2.RdA dataset containing the state-wide counts of offenses for a selected number of crimes since 1979
as reported through the API for the FBI's Crime Data Explorer
at https://cde.ucr.cjis.gov/LATEST/webapp/#/pages/docApi.
Last updated: Sep 20 2023
The variables are as follows (more detail on the FBI website):
fbi.v2Format
A tibble with 26520 rows and 12 columns
- state
name of the state for which numbers are reported.
- state_id
id for each state.
- state_abbr
two letter state abbreviation.
- year
year of the reporting.
- population
state population.
- type
type of crime.
- count
number of reported offenses.
- total_agency_count
total number of crime-solving agencies in the state.
- agency_submitting
number of agencies who reported data.
- population_covered
percent of the state's population covered by reporting agencies.
- source
source of the estimate: SRS (standard reporting system) or NIBRS (national incidence based reporting system)
Examples
# example code
library(tidyverse)
#> ── Attaching core tidyverse packages ──────────────────────── tidyverse 2.0.0 ──
#> ✔ dplyr 1.1.4 ✔ readr 2.1.4
#> ✔ forcats 1.0.0 ✔ stringr 1.5.0
#> ✔ ggplot2 3.4.4 ✔ tibble 3.2.1
#> ✔ lubridate 1.9.3 ✔ tidyr 1.3.0
#> ✔ purrr 1.0.2
#> ── Conflicts ────────────────────────────────────────── tidyverse_conflicts() ──
#> ✖ dplyr::filter() masks stats::filter()
#> ✖ dplyr::lag() masks stats::lag()
#> ℹ Use the conflicted package (<http://conflicted.r-lib.org/>) to force all conflicts to become errors
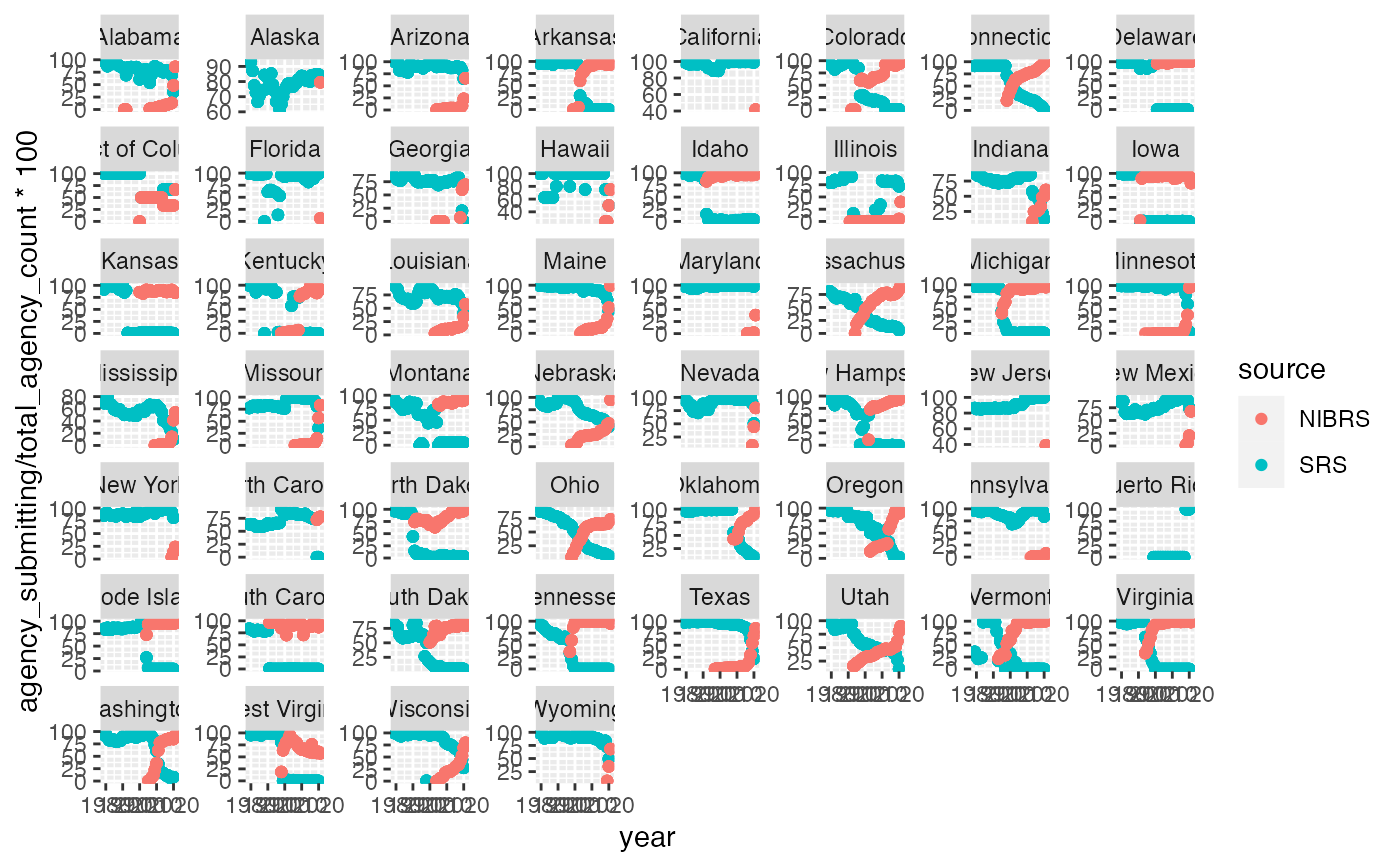
# compliance to report to NIBRS varies drastically by state
fbi.v2 %>%
ggplot(aes(x = year, y = agency_submitting/total_agency_count*100)) +
geom_point(aes(colour = source)) +
facet_wrap(~state, scales="free_y")
#> Warning: Removed 9 rows containing missing values (`geom_point()`).
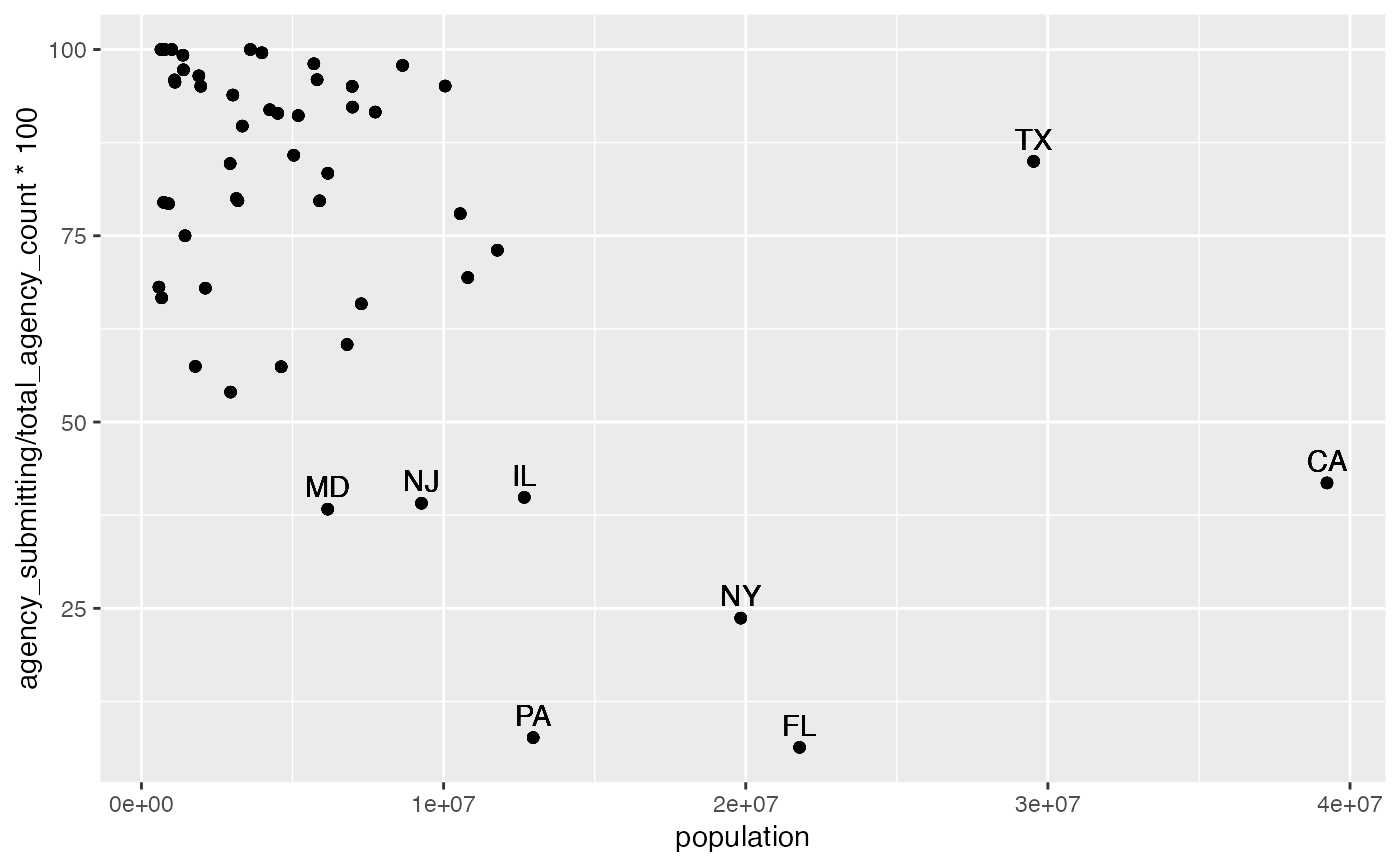
 # population size is related to compliance
fbi.v2 %>%
filter(year==2021) %>%
ggplot(aes(x = population, y = agency_submitting/total_agency_count*100)) +
geom_point() +
geom_text(aes(label=state_abbr),
nudge_y = 3,
data = fbi.v2 %>%
filter(year==2021,
agency_submitting/total_agency_count*100 < 50 |
population > 2e+07) %>% unique())
# population size is related to compliance
fbi.v2 %>%
filter(year==2021) %>%
ggplot(aes(x = population, y = agency_submitting/total_agency_count*100)) +
geom_point() +
geom_text(aes(label=state_abbr),
nudge_y = 3,
data = fbi.v2 %>%
filter(year==2021,
agency_submitting/total_agency_count*100 < 50 |
population > 2e+07) %>% unique())
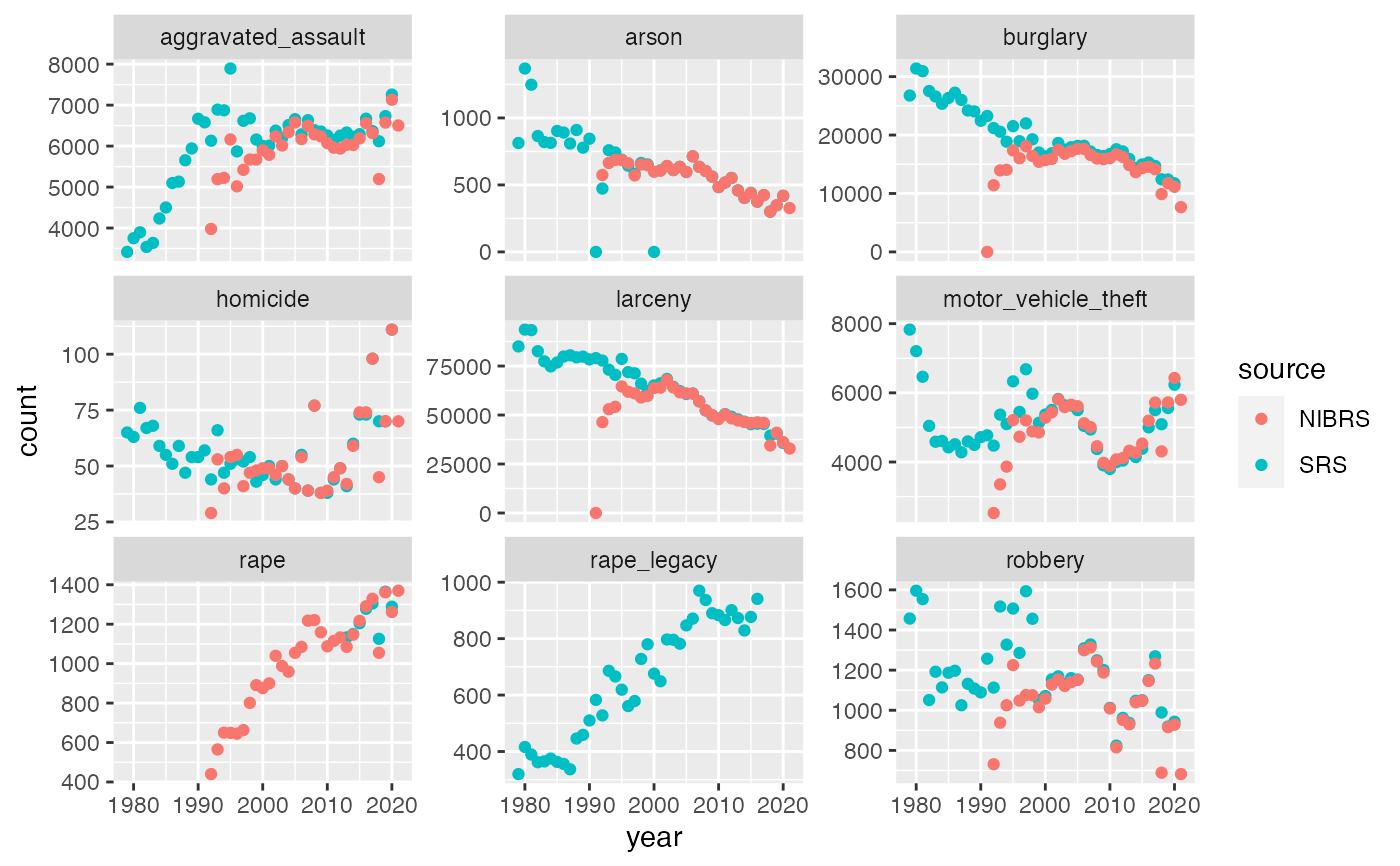
 # comparison of SRS and NIBRS counts in Iowa across all types of offenses
fbi.v2 %>% filter(state_abbr=="IA") %>%
ggplot(aes(x = year, y = count)) +
geom_point(aes(colour = source)) +
facet_wrap(~type, scales="free_y")
#> Warning: Removed 38 rows containing missing values (`geom_point()`).
# comparison of SRS and NIBRS counts in Iowa across all types of offenses
fbi.v2 %>% filter(state_abbr=="IA") %>%
ggplot(aes(x = year, y = count)) +
geom_point(aes(colour = source)) +
facet_wrap(~type, scales="free_y")
#> Warning: Removed 38 rows containing missing values (`geom_point()`).
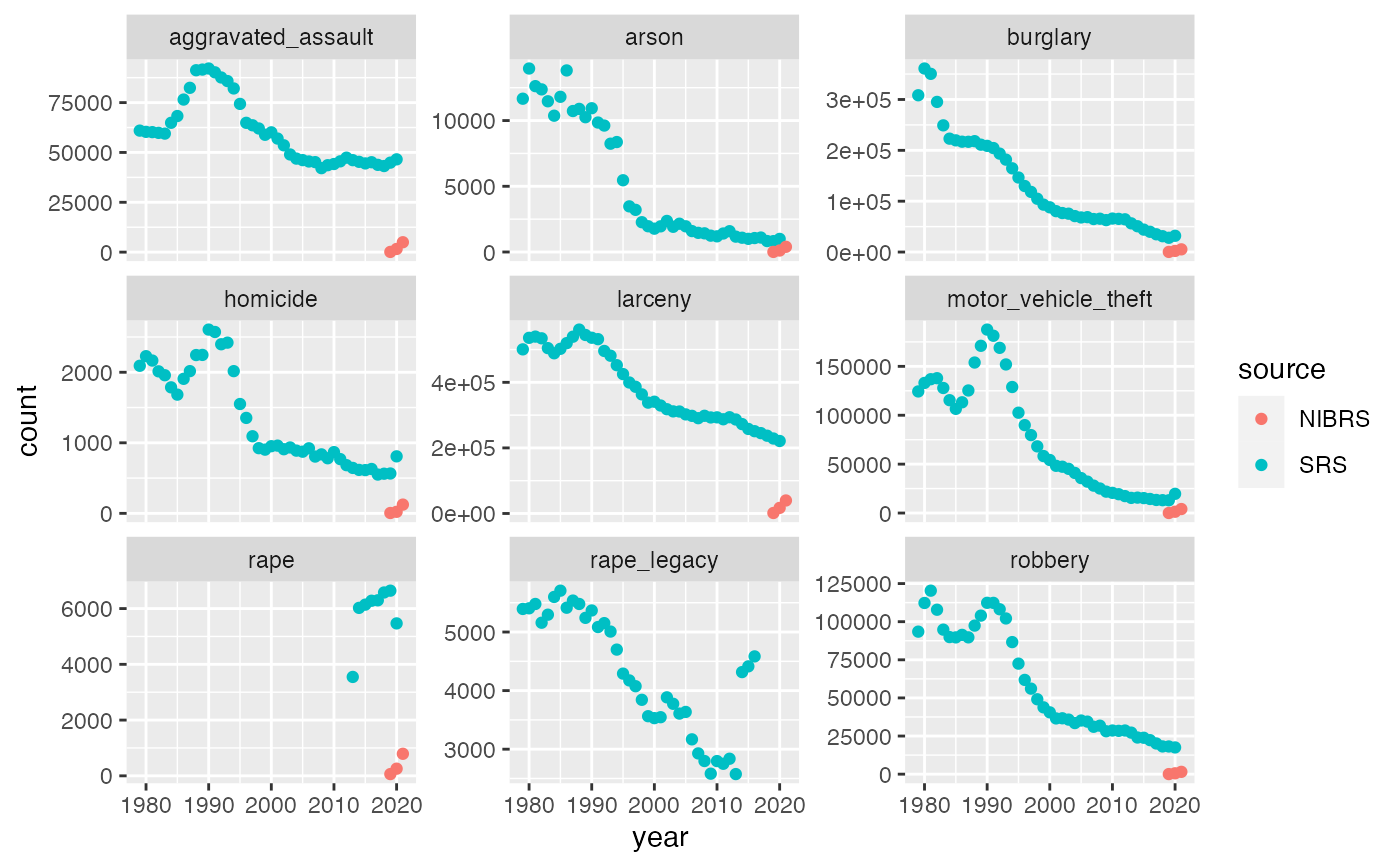
 # comparison of SRS and NIBRS counts in New York across all types of offenses
fbi.v2 %>% filter(state_abbr=="NY") %>%
ggplot(aes(x = year, y = count)) +
geom_point(aes(colour = source)) +
facet_wrap(~type, scales="free_y")
#> Warning: Removed 38 rows containing missing values (`geom_point()`).
# comparison of SRS and NIBRS counts in New York across all types of offenses
fbi.v2 %>% filter(state_abbr=="NY") %>%
ggplot(aes(x = year, y = count)) +
geom_point(aes(colour = source)) +
facet_wrap(~type, scales="free_y")
#> Warning: Removed 38 rows containing missing values (`geom_point()`).