ggplot2 extensions are easy – right??
Heike Hofmann
University of Nebraska-Lincoln
2024-12-04
ggplot2 is …
pretty wildly used (more than 1 million downloads each month)
based on the Grammar of Graphics, i.e conceptually sound
supports a layering system
very flexible with (relatively) good defaults
References:
Components of a ggplot2 chart: data is number 0
mappings (aes): data variables are mapped to graphical elements
layers : geometric elements (geoms, such as points, lines, rectangles, text, …) and statistical transformations (stats, are identity, counts, bins, …)
scales : map values in the data space to values in an aesthetic space (e.g. color, size, shape, but also position)
coordinate system (coord): defaults to Cartesian, but pie charts use e.g. polar coordinates
facetting : for small multiples (subsets) and their arrangement
theme : defaults to theme_grey fine-tune display items, such as font and its size, color of background, margins, …
Defaults!
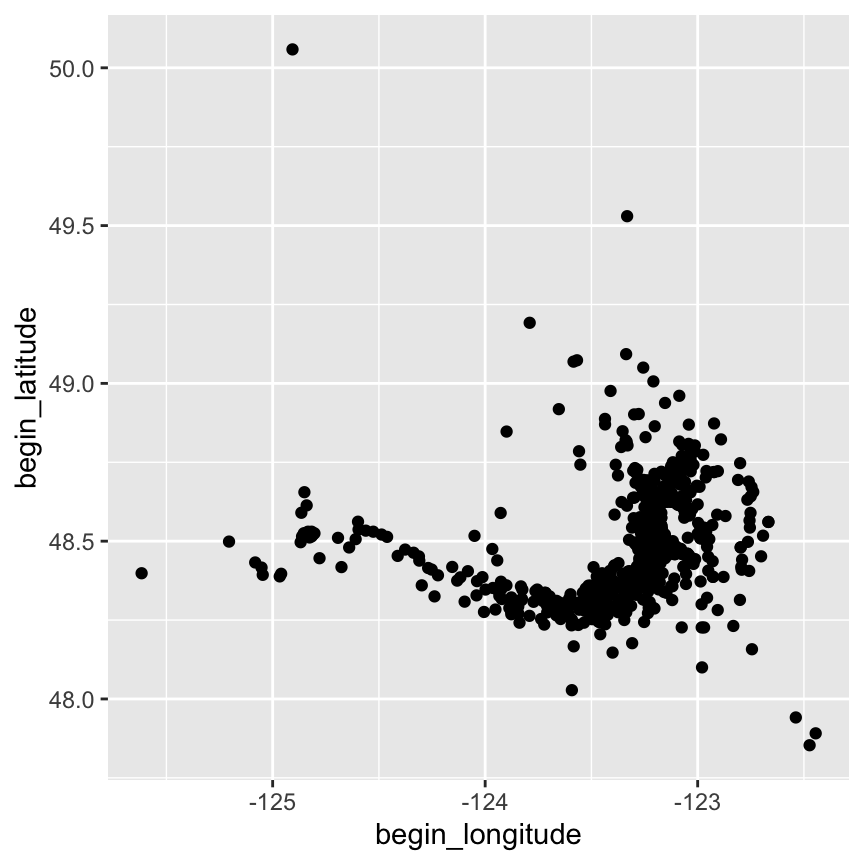
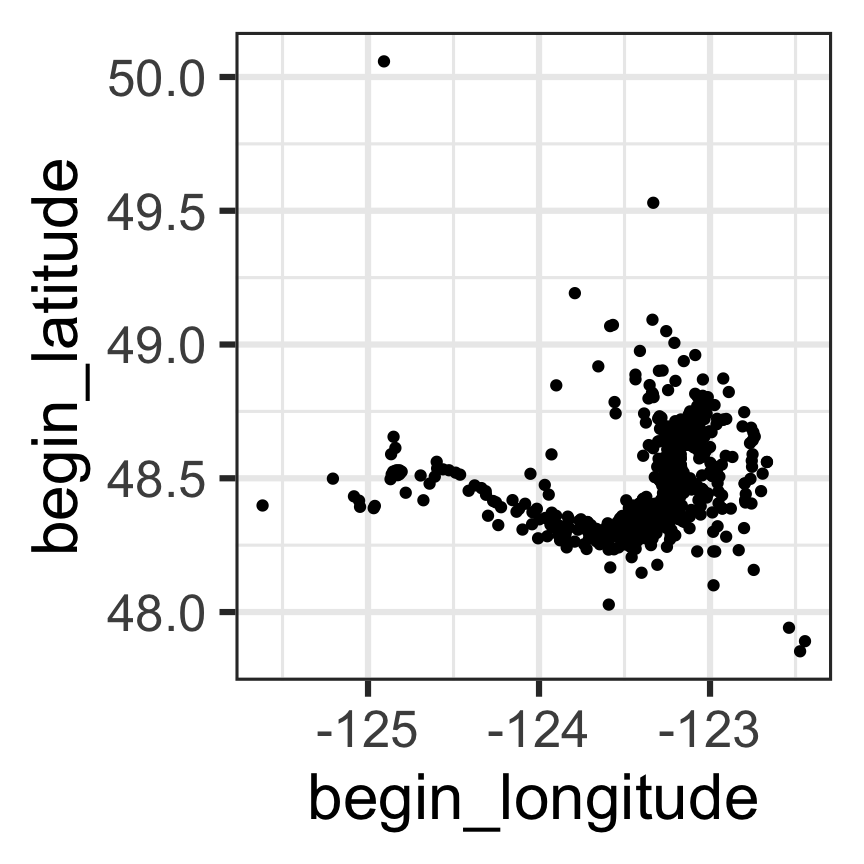
Usually only need data, mapping with aes and one geom:
<- tidytuesdayR:: tt_load (2024 , week = 42 )$ orcas%>% #<< data ggplot (aes (x = begin_longitude, y = begin_latitude)) + geom_point ()
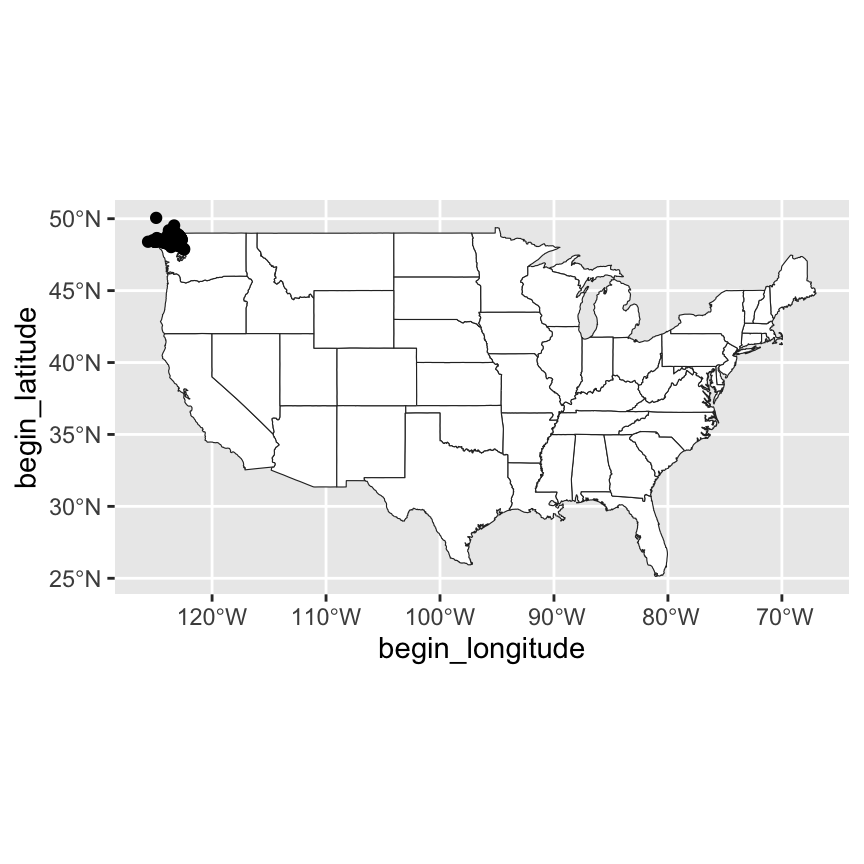
Layering
ggplot (usa) + geom_sf (color = "#2b2b2b" , fill = "white" , size= 0.125 ) + geom_point (aes (x = begin_longitude, y = begin_latitude), data = orcas)
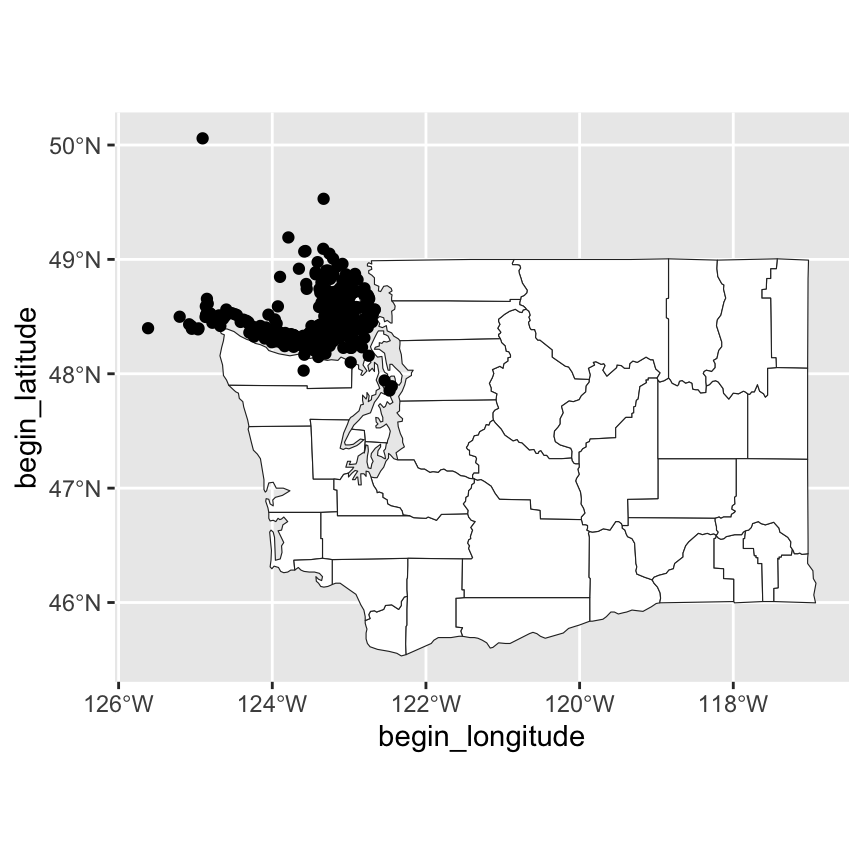
Layering
ggplot (wa) + geom_sf (color = "#2b2b2b" , fill = "white" , size= 0.125 ) + geom_point (aes (x = begin_longitude, y = begin_latitude), data = orcas)
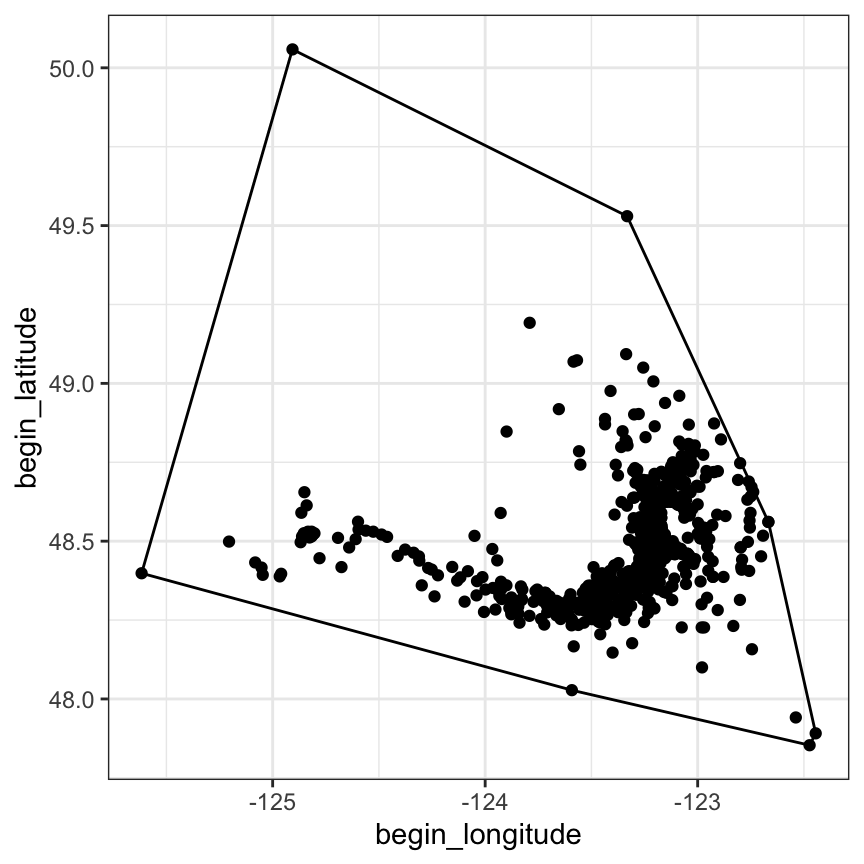
A first extension
from ggplot2 vignette on extensions
Making a convex hull: Object definition
<- ggproto ("StatChull" , Stat,required_aes = c ("x" , "y" ),compute_group = function (data, scales) {chull (data$ x, data$ y), , drop = FALSE ]
Each object needs to be made
<- function (mapping = NULL , data = NULL , geom = "polygon" ,position = "identity" , na.rm = FALSE ,show.legend = NA , inherit.aes = TRUE , ...) {layer (stat = StatChull, data = data, mapping = mapping, geom = geom, position = position, show.legend = show.legend, inherit.aes = inherit.aes, params = list (na.rm = na.rm, ...)
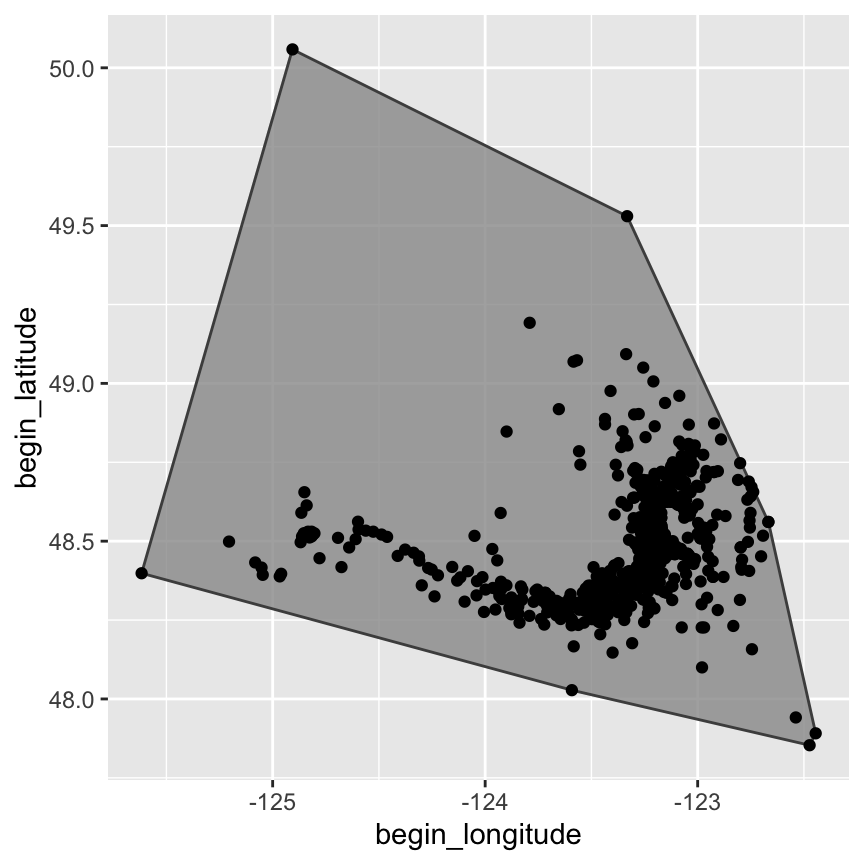
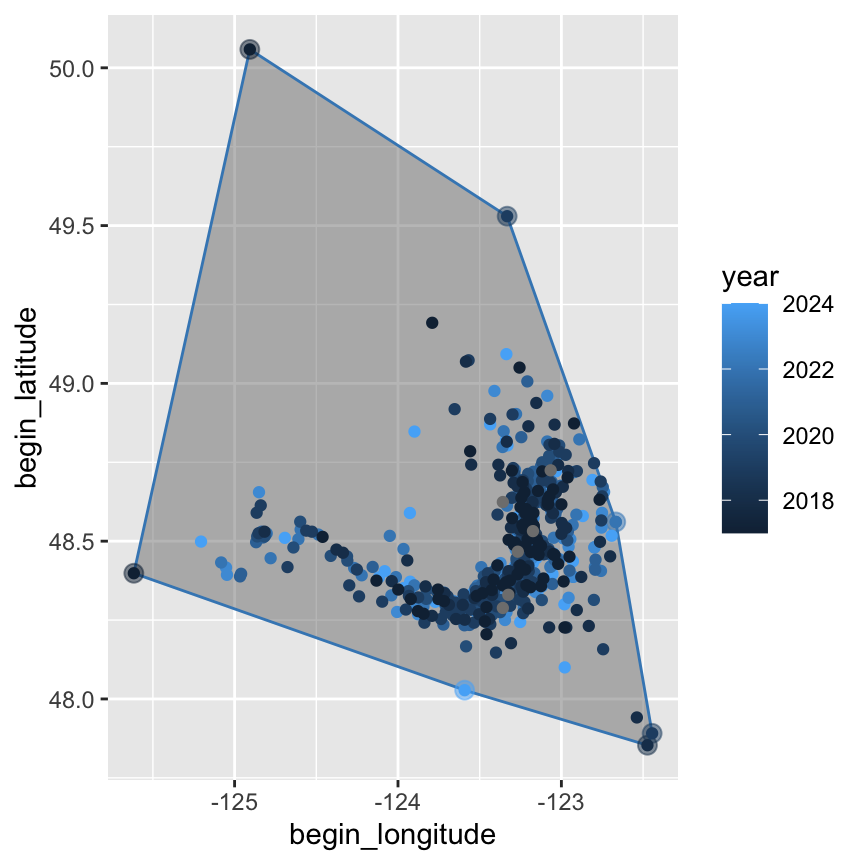
Now use it
%>% ggplot (aes (x = begin_longitude, y = begin_latitude)) + geom_point () + stat_chull (fill= NA , colour = "black" ) + theme_bw ()
A Stat? That wasn’t on the list!
Every geom has a (default) stat
function (mapping = NULL, data = NULL, stat = "identity", position = "identity",
    ..., na.rm = FALSE, show.legend = NA, inherit.aes = TRUE)
{
    layer(data = data, mapping = mapping, stat = stat, geom = GeomPoint,
        position = position, show.legend = show.legend, inherit.aes = inherit.aes,
        params = list2(na.rm = na.rm, ...))
}
<bytecode: 0x7fe8d441f230>
<environment: namespace:ggplot2>
The Stat and its Geom produce the same layer
geom_point: na.rm = FALSE
stat_identity: na.rm = FALSE
position_identity
geom_point: na.rm = FALSE
stat_identity: na.rm = FALSE
position_identity
Each function provides access to a different aspect in the layer: geoms control the look, stats control the data aspects
We can use stat_identity instead of geom_point
%>% ggplot (aes (x = begin_longitude, y = begin_latitude)) + stat_identity ()
Object-oriented foundation
Every extension starts at the geom/stat level
ggplot2 is expecting a Geom and a Stat specification for every layer
But: you don’t need to (and can not) start from scratch
Two prototype objects: ggplot2::Geom and ggplot2::Stat
The Geom Object
<ggproto object: Class Geom, gg>
    aesthetics: function
    default_aes: uneval
    draw_group: function
    draw_key: function
    draw_layer: function
    draw_panel: function
    extra_params: na.rm
    handle_na: function
    non_missing_aes:
    optional_aes:
    parameters: function
    rename_size: FALSE
    required_aes:
    setup_data: function
    setup_params: function
    use_defaults: function
The Stat Object
<ggproto object: Class Stat, gg>
    aesthetics: function
    compute_group: function
    compute_layer: function
    compute_panel: function
    default_aes: uneval
    dropped_aes:
    extra_params: na.rm
    finish_layer: function
    non_missing_aes:
    optional_aes:
    parameters: function
    required_aes:
    retransform: TRUE
    setup_data: function
    setup_params: function
Useful (?) Strategy
Rely on the defaults: pick the Geom/Stat that is closest to what you want to do, and expand
Make minimal changes otherwise
A look back
Specifies required mappings, and compute_group
<- ggproto ("StatChull" , Stat,required_aes = c ("x" , "y" ),compute_group = function (data, scales) {chull (data$ x, data$ y), , drop = FALSE ]
Linking between StatChull and polygon
<- function (mapping = NULL , data = NULL , geom = "polygon" ,position = "identity" , na.rm = FALSE ,show.legend = NA , inherit.aes = TRUE , ...) {layer (stat = StatChull, data = data, mapping = mapping, geom = geom, position = position, show.legend = show.legend, inherit.aes = inherit.aes, params = list (na.rm = na.rm, ...)
What do you need to change when …
you want to …
put on branding on charts? the theme
automatically combine several layers? the geom
implement a new type of chart? everything
Making a new theme
<- theme_bw (base_size = 24 )%>% ggplot (aes (x = begin_longitude, y = begin_latitude)) + stat_identity () + theme_slides
Wrapping multiple layers into one
%>% ggplot (aes (x = begin_longitude, y = begin_latitude)) + stat_chull (fill= "grey60" , colour = "grey30" , alpha = 0.8 ) + geom_point ()
Wrapper for defaults
Define defaults
<- ggproto ("GeomChull" , GeomPolygon,default_aes = ggplot2:: aes (colour = "grey30" , fill = "grey50" , alpha = 0.5 , # new ones linewidth= 0.5 , linetype = 1 , subgroup= NULL
Basis is geom_polygon
Change stat to chull, and GeomPolygon to GeomChull.
Everything else stays the same
<- function (mapping = NULL , data = NULL , stat = "chull" , position = "identity" , rule = "evenodd" , ..., na.rm = FALSE , show.legend = NA , inherit.aes = TRUE ) layer (data = data, mapping = mapping, stat = stat, geom = GeomChull, position = position, show.legend = show.legend, inherit.aes = inherit.aes, params = list (na.rm = na.rm, rule = rule, ...))
Previous example
%>% ggplot (aes (x = begin_longitude, y = begin_latitude)) + # stat_chull(fill="grey60", colour = "grey30", alpha = 0.8) + geom_chull () + geom_point ()
Show edge points with the frame … prepping
<- ggproto ("GeomChull" , GeomPolygon,default_aes = ggplot2:: aes (colour = "grey30" , fill = "grey50" , alpha = 0.5 , # new ones linewidth= 0.5 , linetype = 1 , subgroup= NULL ,size = 3 , shape = 19 , stroke = 0.5 # for the points draw_panel = function (..., self = self) {$ draw_panel (..., self)
Nothing has changed yet
%>% ggplot (aes (x = begin_longitude, y = begin_latitude)) + # stat_chull(fill="grey60", colour = "grey30", alpha = 0.8) + geom_chull () + geom_point ()
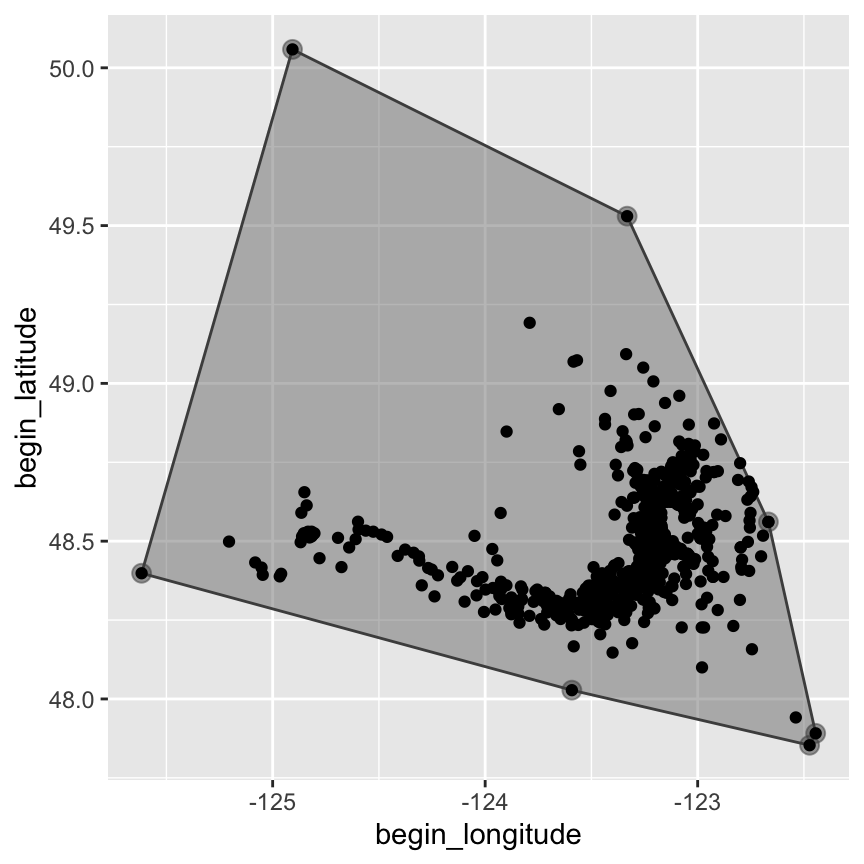
Show edge points with the frame
<- ggproto ("GeomChull" , GeomPolygon,default_aes = ggplot2:: aes (colour = "grey30" , fill = "grey50" , alpha = 0.5 , # new ones linewidth= 0.5 , linetype = 1 , size = 3 , shape = 19 , stroke = 0.5 # for the points draw_panel = function (..., self = self) {# using the two layers together :: grobTree ($ draw_panel (..., self),$ draw_panel (..., self)
%>% ggplot (aes (x = begin_longitude, y = begin_latitude)) + geom_chull () + geom_point ()
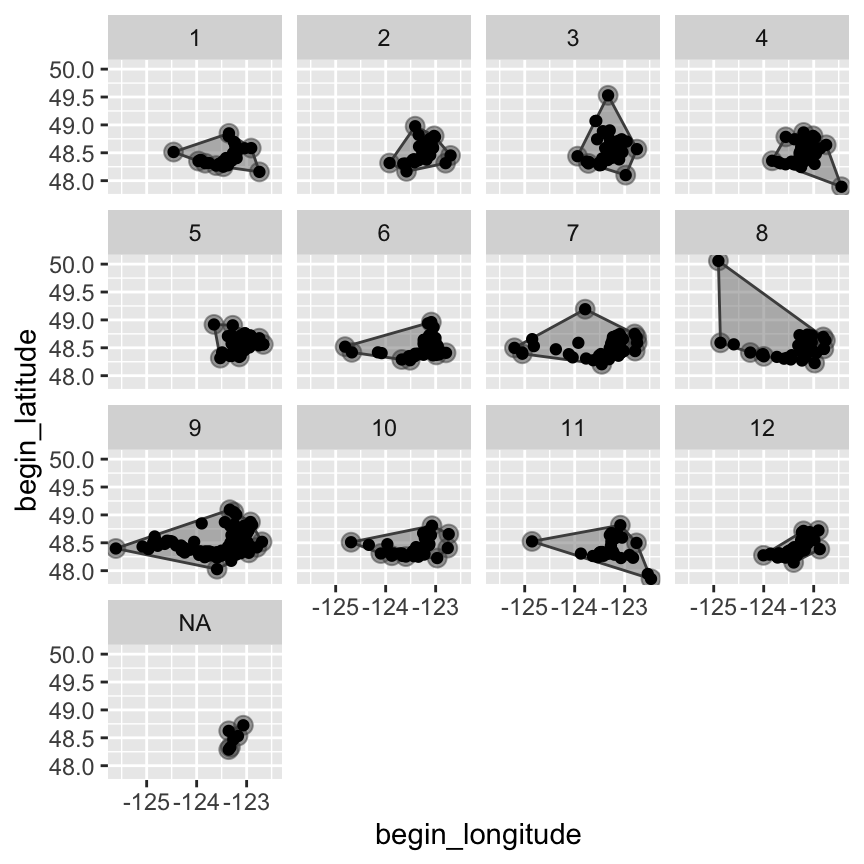
Freebies: Facetting
%>% ggplot (aes (x = begin_longitude, y = begin_latitude)) + geom_chull () + geom_point () + facet_wrap (~ month (date))
Supposed Freebie: Color/groups
%>% ggplot (aes (x = begin_longitude, y = begin_latitude, colour = year)) + geom_chull () + geom_point ()
Why does this not draw separate convex hulls for each group?
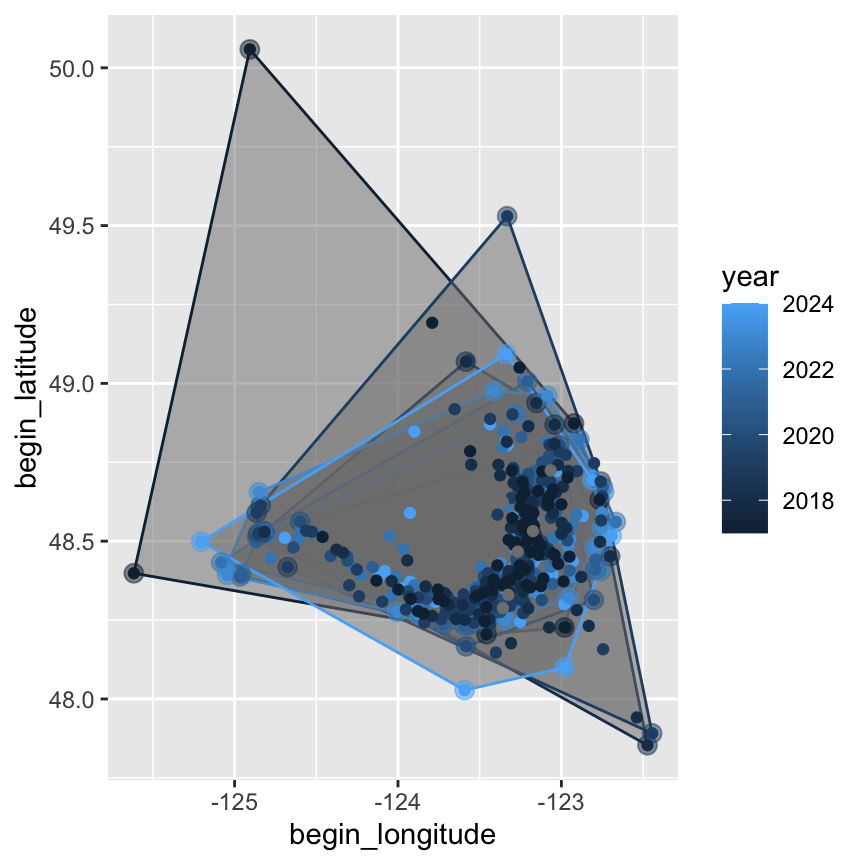
Specify the group explicitly!
%>% ggplot (aes (x = begin_longitude, y = begin_latitude, colour = year, group = year)) + geom_chull () + geom_point ()
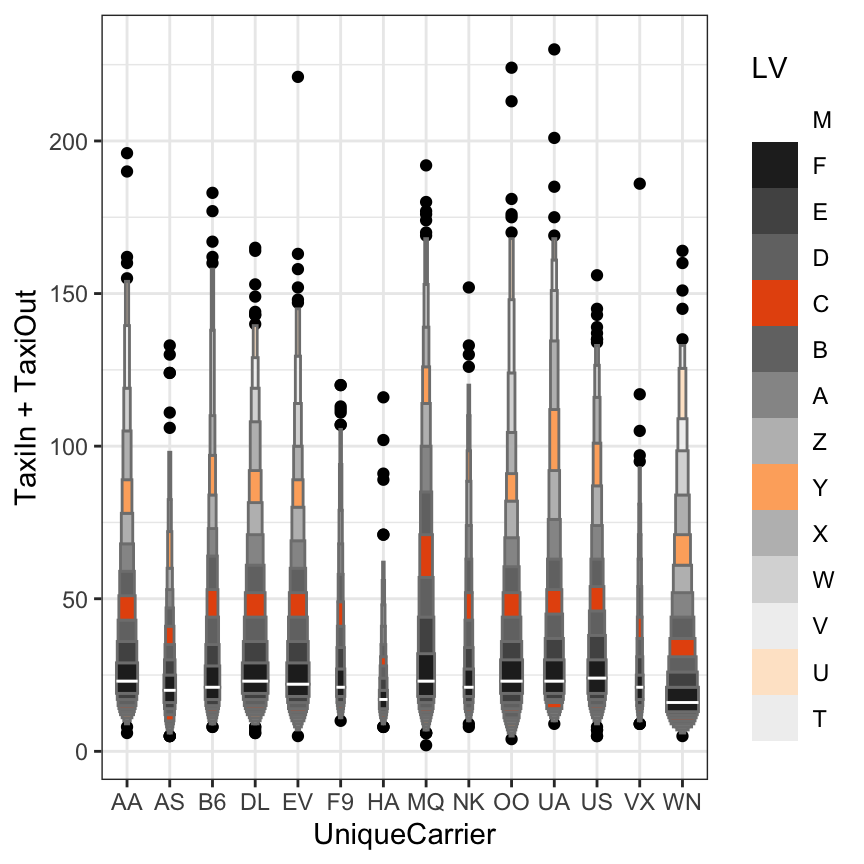
Changing everything: the lvplot package
Making a new chart: letter value (box)plots are a suggestion by JW Tukey in Exploratory Data Analysis (~1980)
Instead of just doing a box for Quartiles, the next set of \(2^{-k}\) quantiles are included (called the F ourth, the E ighths, D, C, B, A, Z, …)
Implements pairs geom_lv, GeomLv, and stat_lv, StatLv
ggplot (ontime, aes (UniqueCarrier, TaxiIn + TaxiOut)) + geom_lv (aes (fill = after_stat (LV)), varwidth= TRUE ) + scale_fill_lv () + theme_bw ()
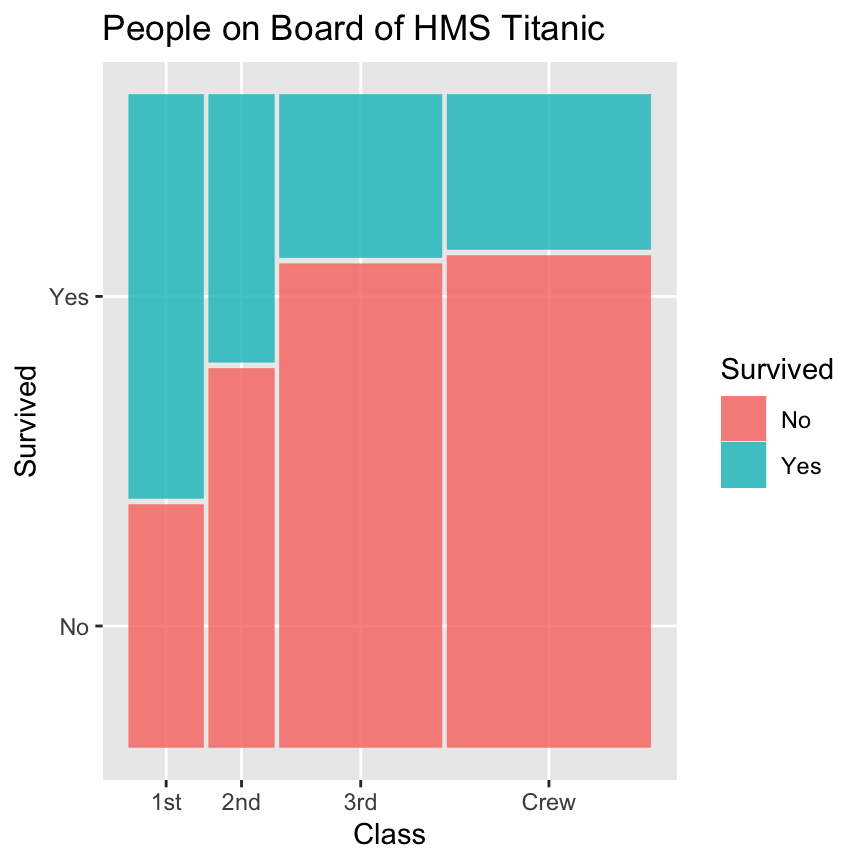
Another new graphic: Mosaicplots
Besides implementing a geom and a stat - what else is needed?
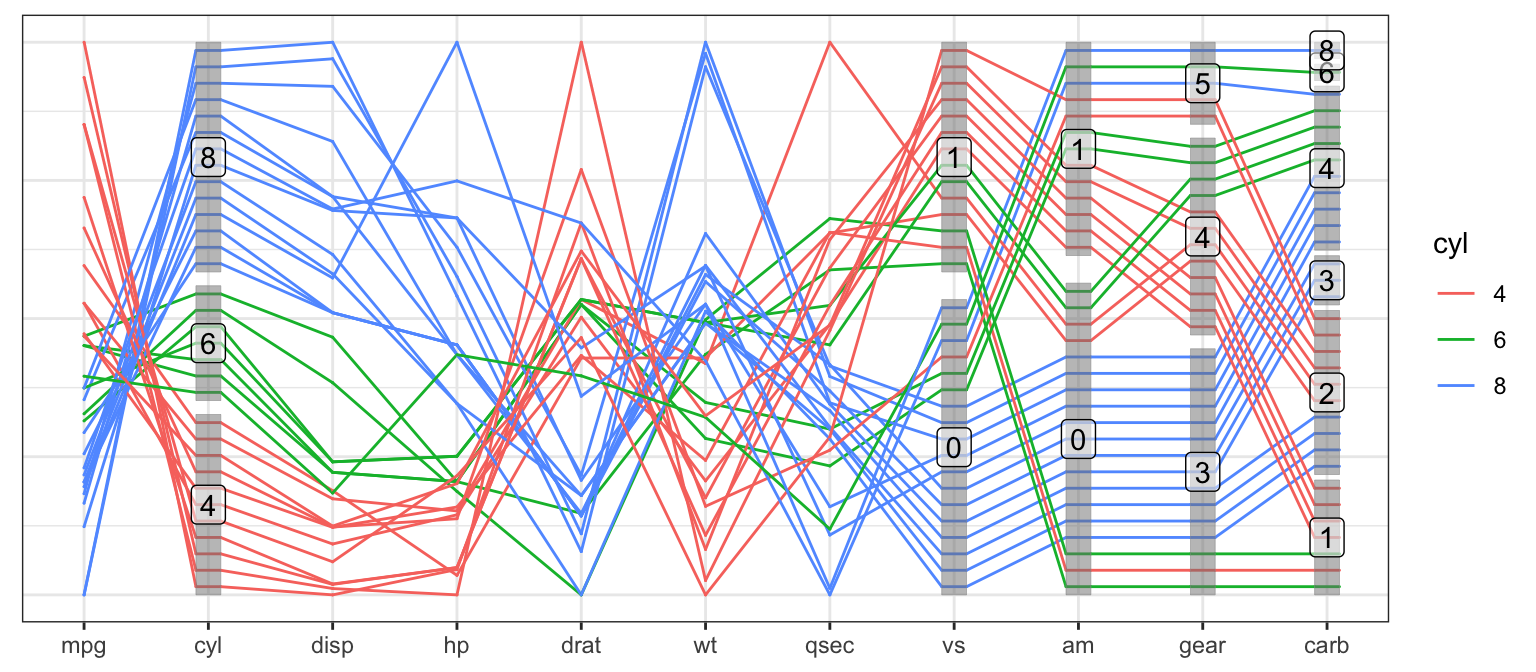
Parallel Coordinate Plots
How about this one?